Sankey Chart
1. What Can a Sankey Chart Show?
A Sankey chart shows how data is distributed across different categories or flows from one category to another. Each column represents a data dimension, and each node within a column represents a category in that dimension.
The taller the node, the greater the value associated with that category. The wider the connecting link, the greater the quantity or amount flowing between the two adjacent categories.
With two dimensions, a Sankey chart can show the flow from a source to a destination, such as Source Warehouse → Destination Store. Adding more dimensions provides a more detailed view of how data is distributed, such as Order Month → Sales Region → Order Status.
Common Use Cases
- Sales Order Analysis: See how orders from each month are distributed across sales regions and how orders in each region are distributed by status.
- Inventory Transfer Analysis: Track which stores receive inventory from each warehouse and the quantity of goods transferred along each path.
- Ticket Handling Analysis: See which teams handle tickets from different sources and how the resolution outcomes are distributed across teams.
- Expense Allocation Analysis: Analyze allocated amounts by expense category and responsible department to identify which departments bear the largest share of each expense.
Choosing the Right Chart
| Question | Recommended Chart |
|---|---|
| What are the statuses of orders in each sales region? | Sankey Chart |
| What proportion of total orders comes from each sales region? | Pie Chart / Doughnut Chart / Treemap |
| What are the conversion rates at each stage, from order placement to payment and shipment? | Funnel Chart |
| How many orders are there in each region and status? | Pivot Table |
2. Example: Analyze Order Distribution by Month, Region, and Status
Using a Sales Orders worksheet as an example, each record represents an order and contains fields such as Order Date, Sales Region, and Order Status.
This example shows how to analyze the distribution of orders across sales regions by month, and then break down the orders in each region by status.
Step 1: Select the Data Source and Chart Type
- Create a new chart and configure the data source using View, Time, and Permissions.
- Select Sankey Chart as the chart type.
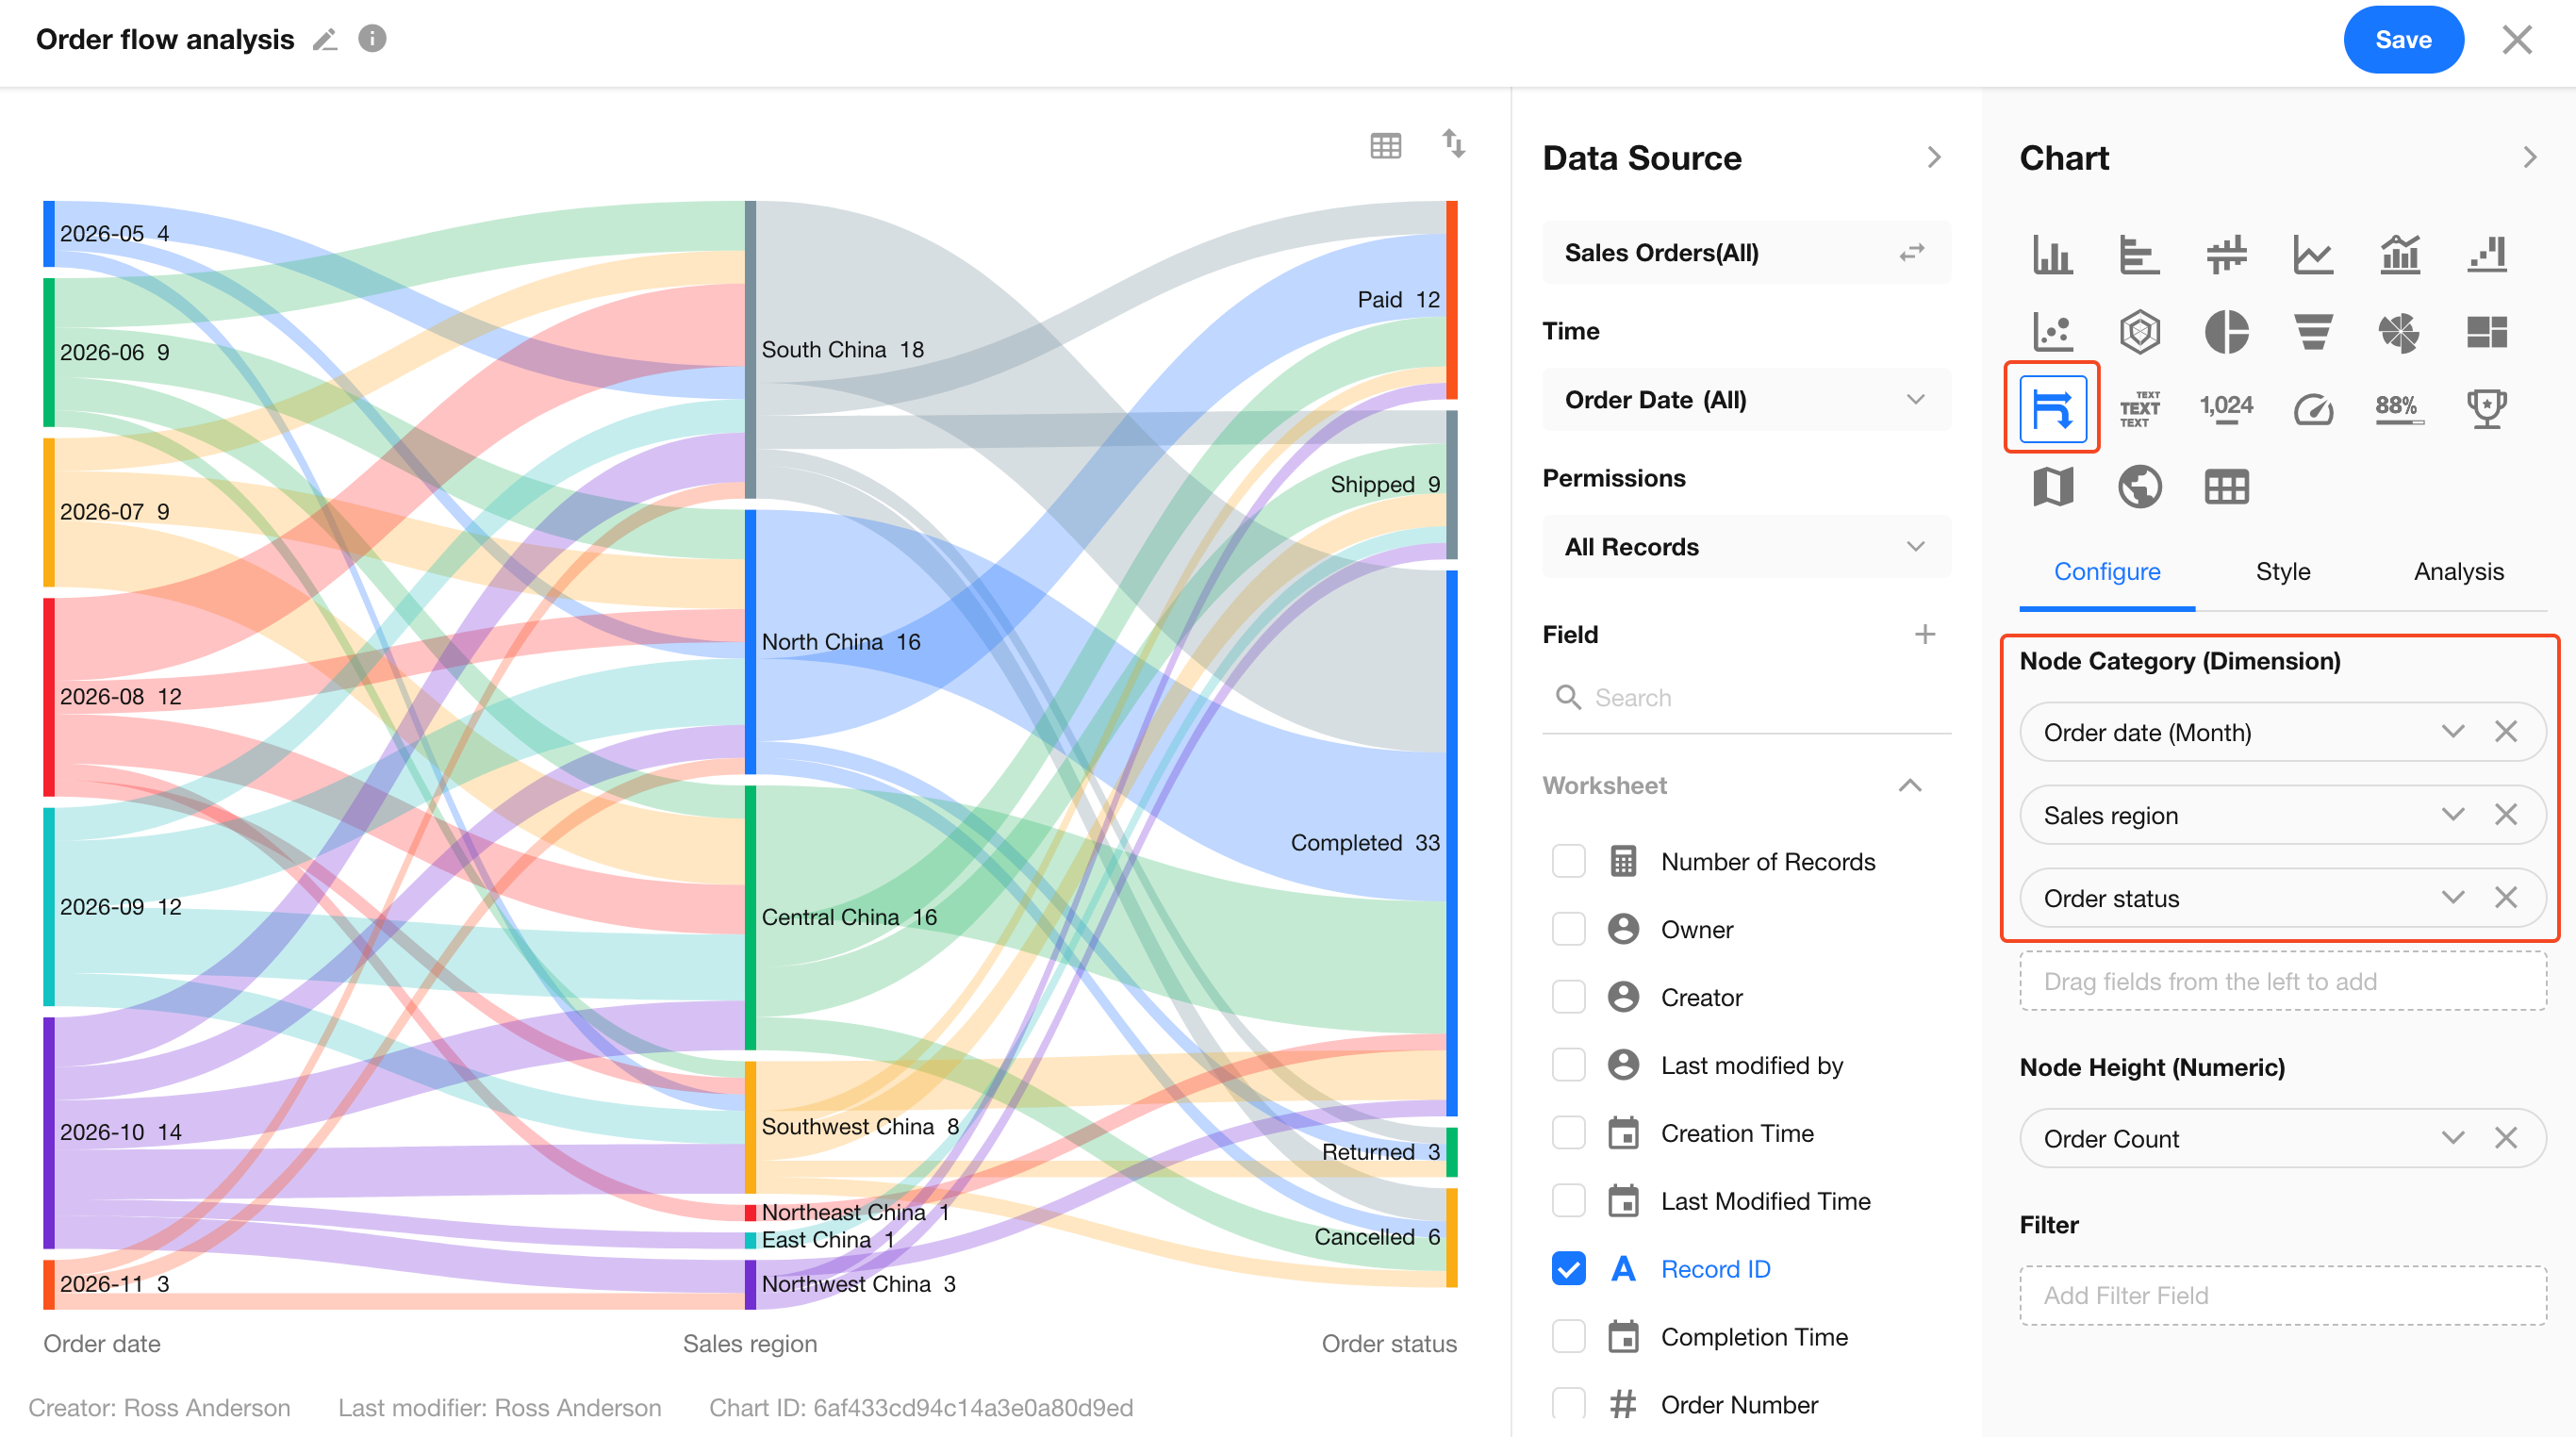
Step 2: Configure Node Dimensions and Values
Under Configuration, set the following options.
The order of fields under Node Categories (Dimensions) determines the left-to-right order of the node columns in the chart.
| Setting | Example | Description |
|---|---|---|
| Node Categories (Dimensions) - Level 1 | Order Date, grouped by month | Displays order months in the leftmost column. |
| Node Categories (Dimensions) - Level 2 | Sales Region | Displays the sales regions associated with the orders in the middle column. |
| Node Categories (Dimensions) - Level 3 | Order Status | Displays the current order statuses in the rightmost column. |
| Node Height (Value) | Order Count | In this example, records are counted by Record ID. The resulting order count determines node heights and link widths. |
Step 3: Preview and Save the Chart
- Read the Nodes: South China 18 indicates that there are 18 orders in the South China region within the selected reporting period. Completed 33 indicates that 33 orders across all regions have the Completed status.
- Read the Links: 2026-10 → South China represents orders placed in the South China region in October 2026. South China → Completed represents completed orders in the South China region across all months included in the reporting period.
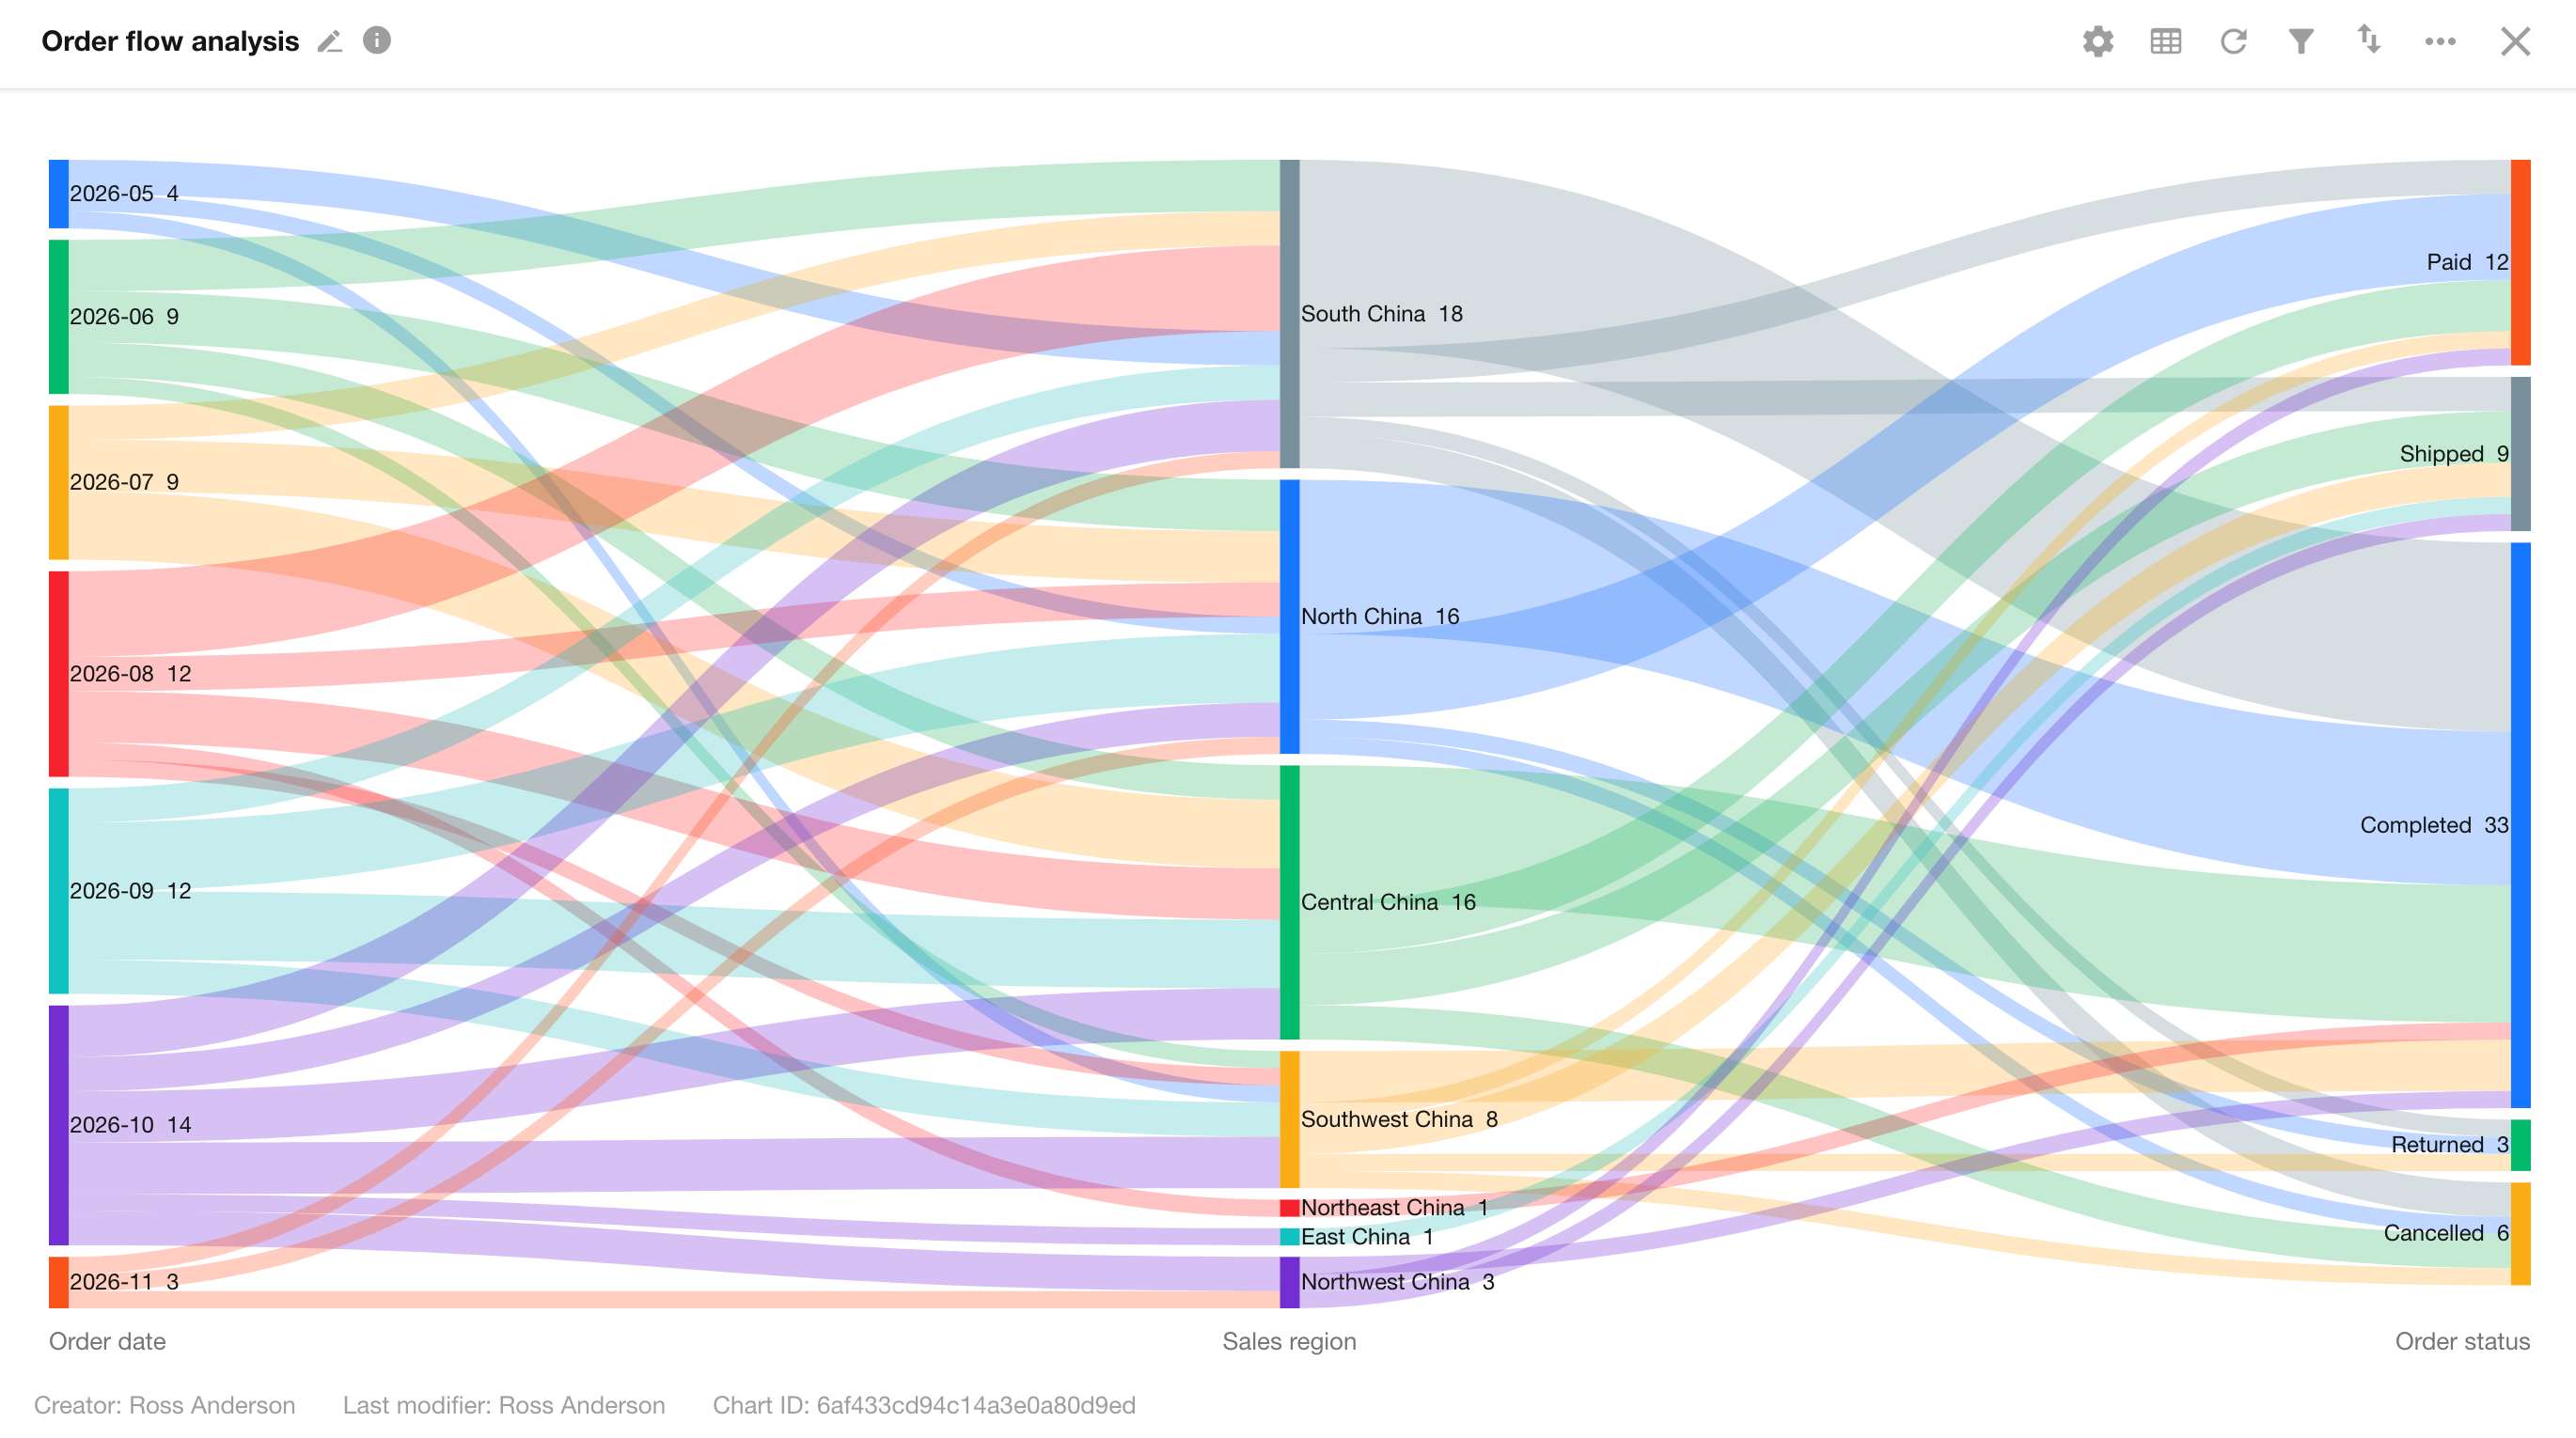
Once you are satisfied with the preview, click Save.
For more information about creating charts and configuring filters and styles, see Chart Configuration and Usage Guide.
Was this document helpful?