Waterfall Chart
1. Overview
Waterfall charts illustrate how individual values contribute to a running total through a series of additions and subtractions, ultimately resulting in a final total.
Each data bar starts at the cumulative position reached by the previous item. Positive values increase the running total, while negative values decrease it. The height of each bar represents the magnitude of the increase or decrease, and its ending position indicates the cumulative value after that item is applied.
Common Use Cases:
- Monthly Sales Accumulation: Track the actual amount paid for each month and the cumulative amount up to each month.
- Inventory Changes: Start with the opening inventory, add incoming stock, and subtract outgoing and scrapped stock to calculate the closing inventory.
- Profit Breakdown: Treat revenue as positive values and costs and expenses as negative values to see how each item contributes to the final profit.
2. Example: Analyze Monthly Amounts Paid
Using a Sales Orders worksheet as an example, this tutorial uses the Order Date and Amount Paid fields.
- Create a new chart and configure the data source using View, Time, and Permissions.
- Select Waterfall Chart as the chart type.
- Under Category Axis (Dimension), select the Order Date field and group the data by month.
- Under Value Axis (Value), select the Amount Paid field and set the aggregation method to Sum.
- Check that the months in the preview are sorted chronologically, then click Save.
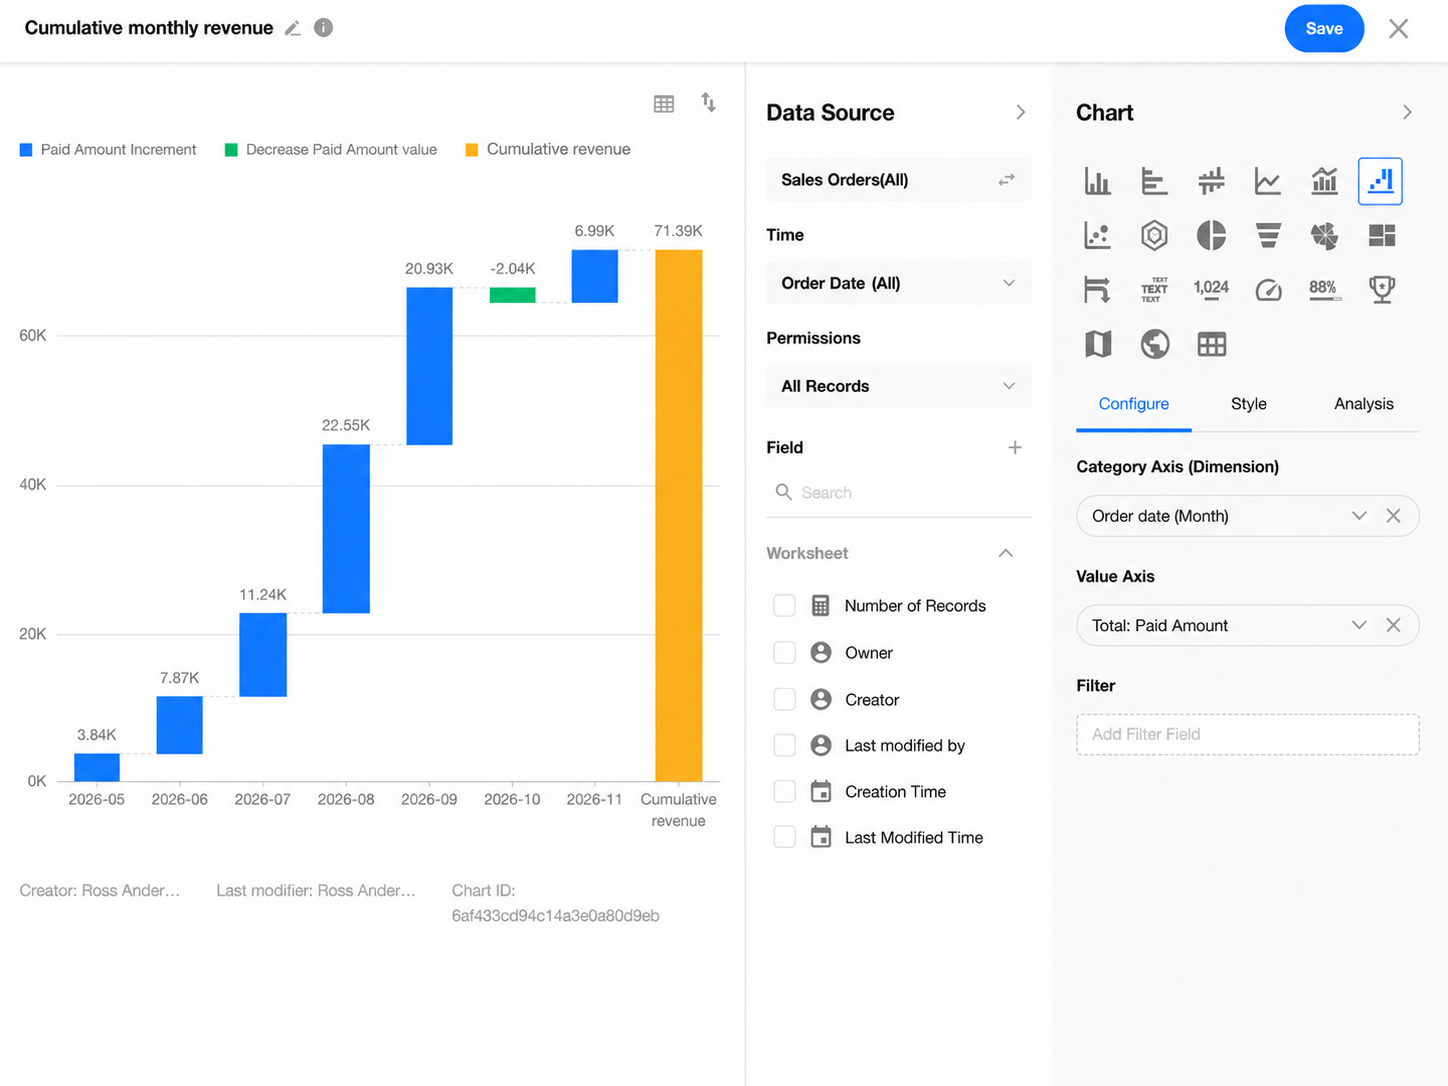
Each data bar represents the total amount paid for orders placed during that month. Even if the amount for a month is lower than that of the previous month, the cumulative total will still increase as long as the monthly amount is positive.
The rightmost total bar shows the sum of all amounts paid within the selected reporting period.
For more information about creating charts and configuring filters and styles, see Chart Configuration and Usage Guide.
Was this document helpful?