How to Create an Application
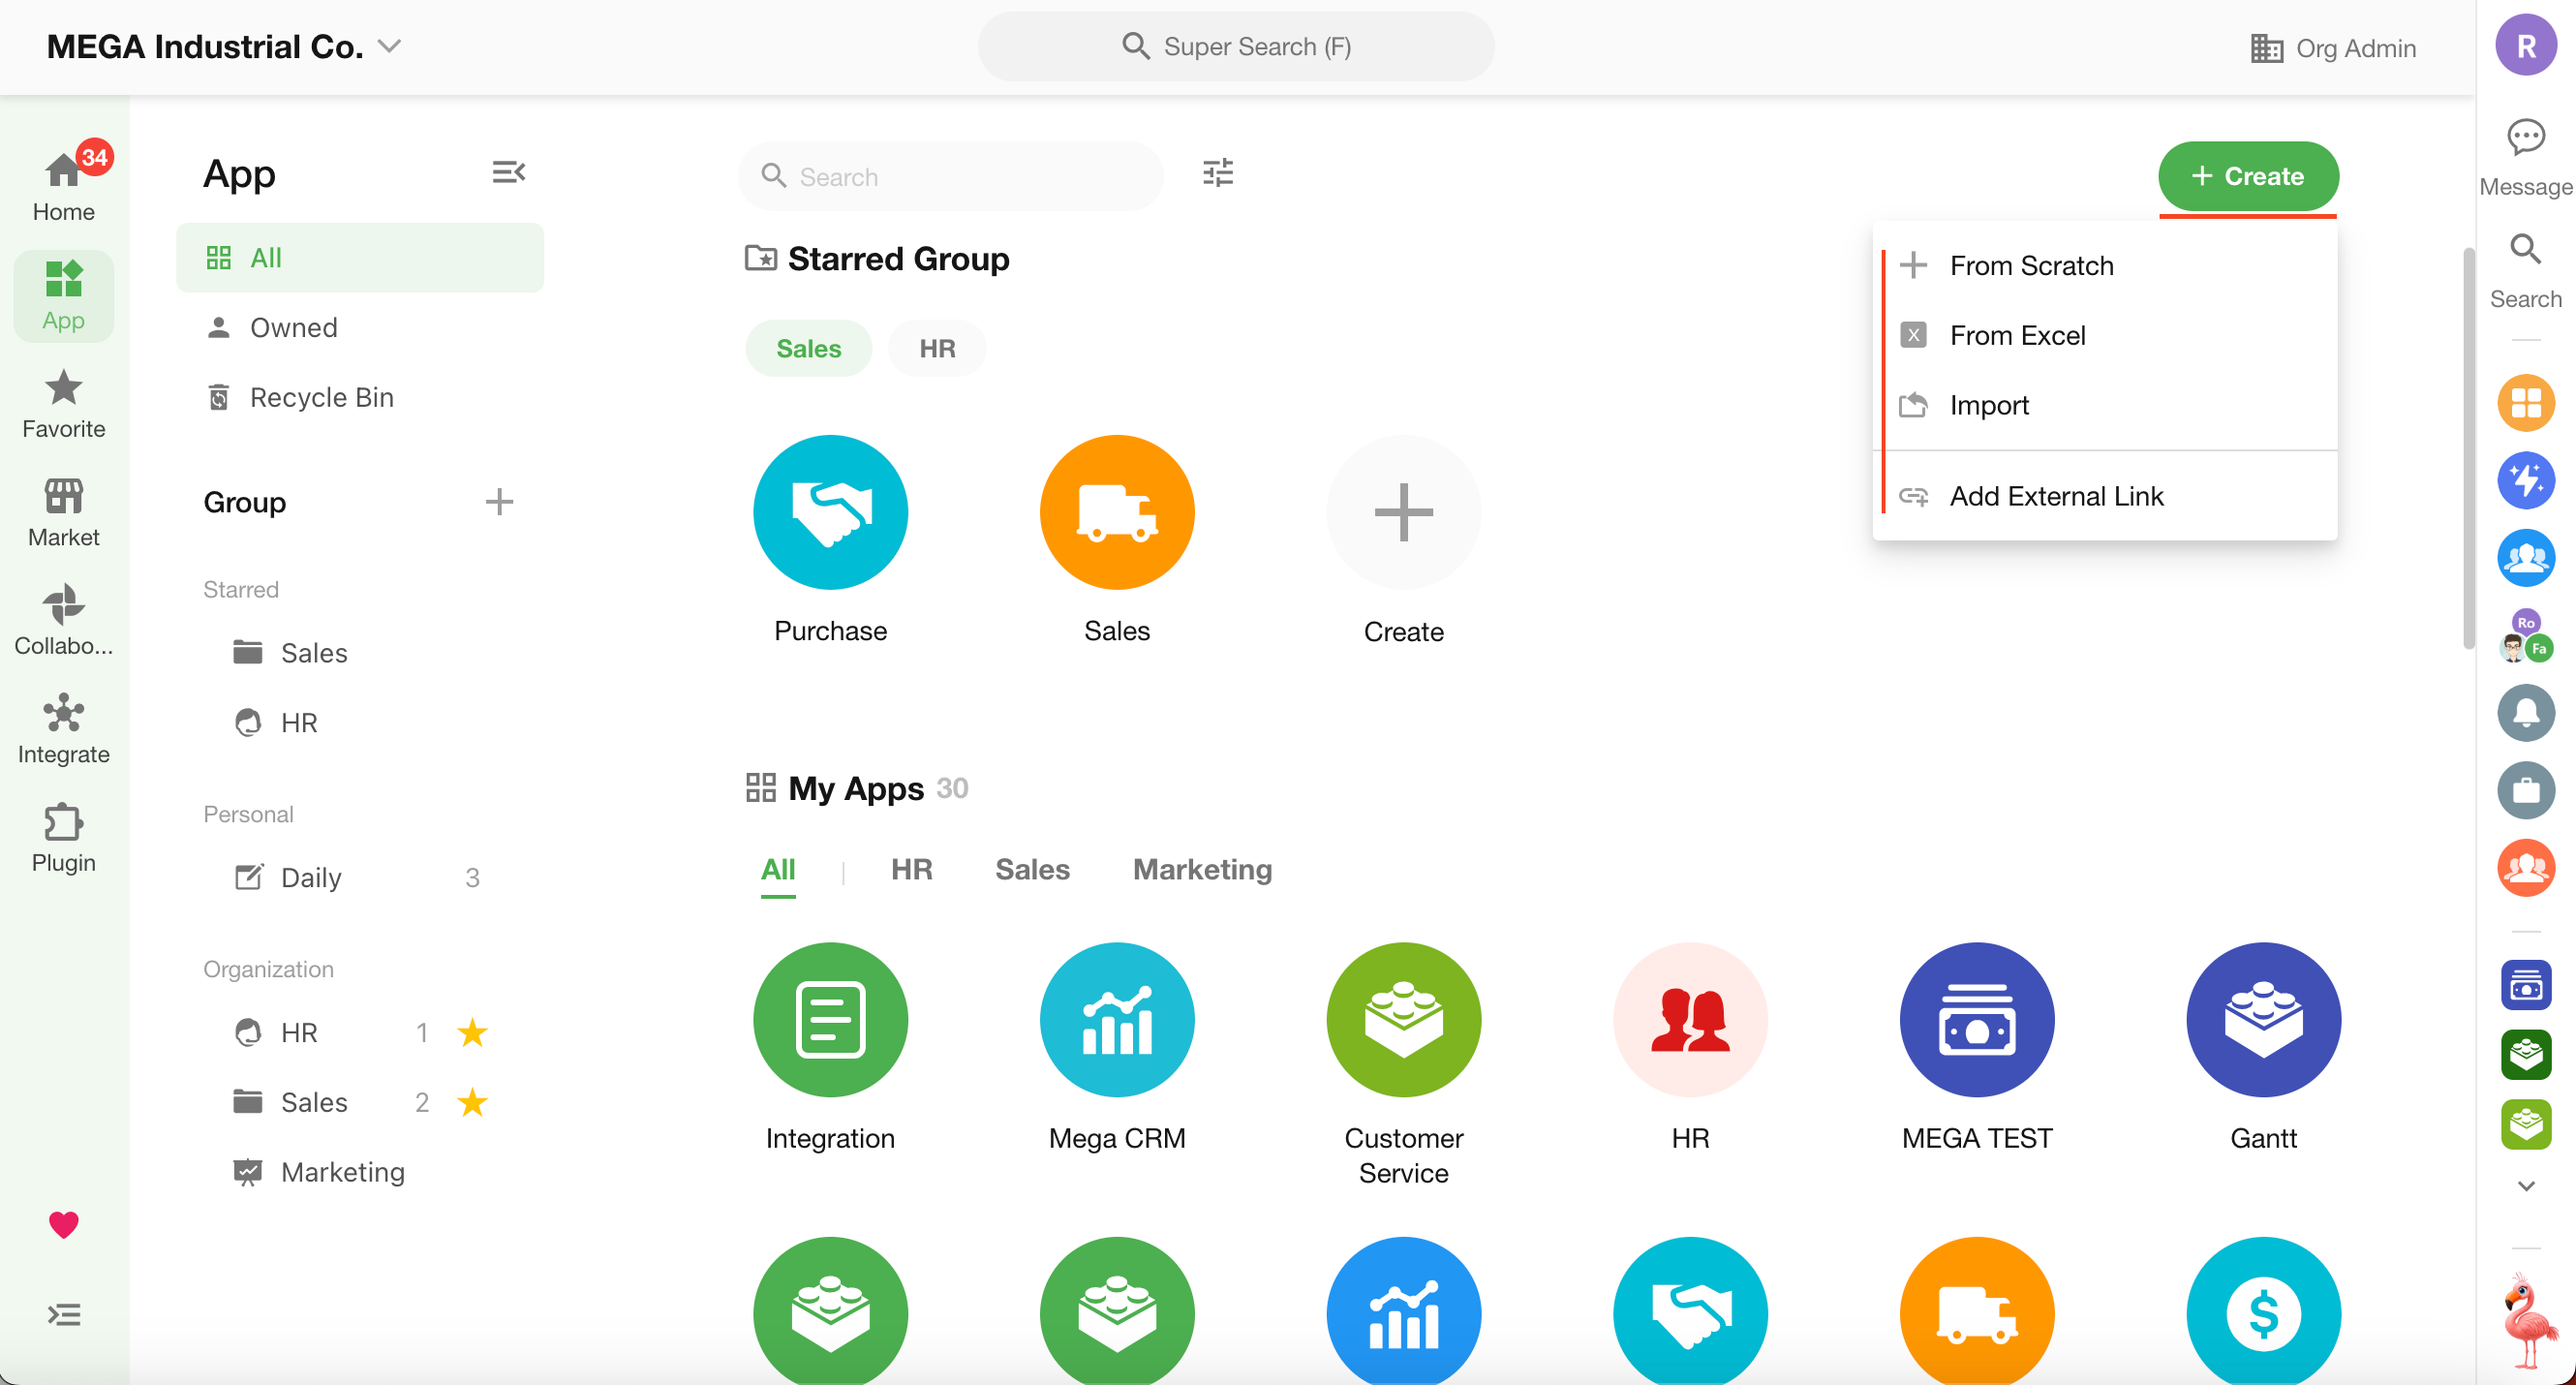
There are four ways to create a new application:
- Create from scratch (this article focuses on this method)
- Import Excel to create an application
- Import an application file
- Add an external link
Application Setup Steps
- Create the application: set the application name, theme color, and icon
- Create the required worksheets
- Create views within each worksheet
- Configure roles and permissions
- Configure workflows
- Create charts and dashboards
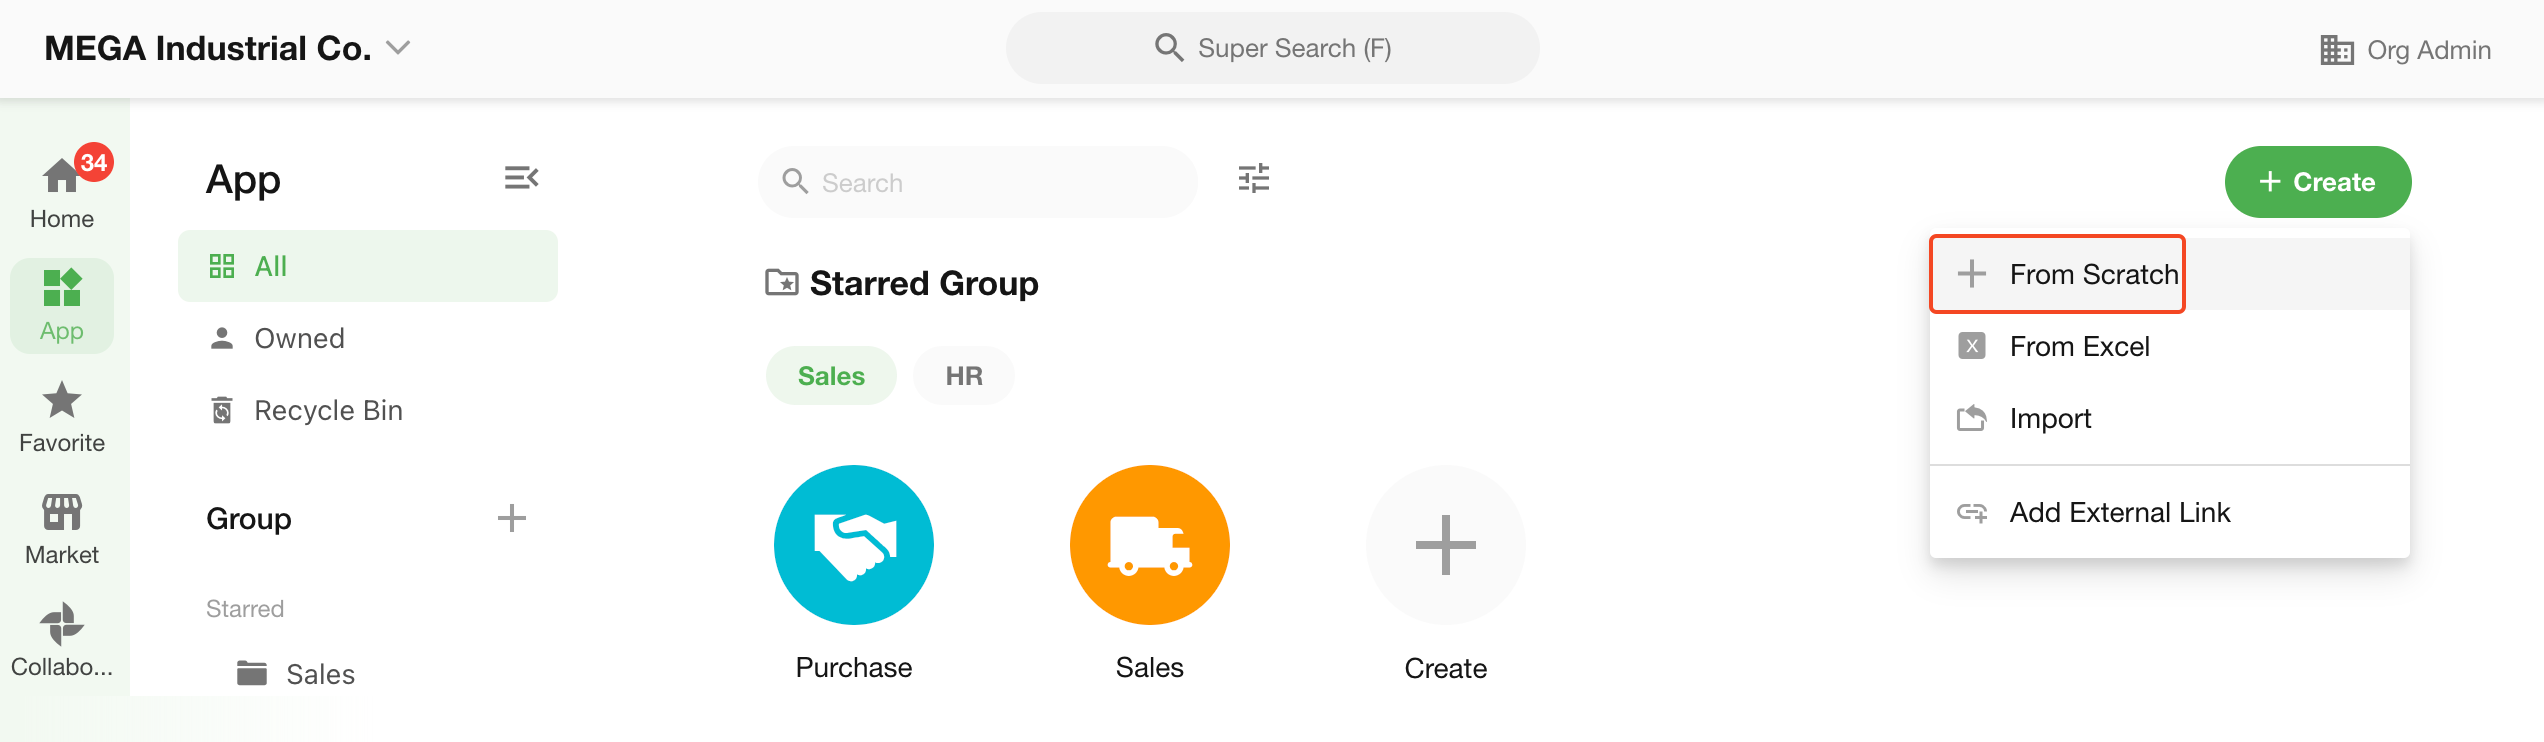
1. Create a New Application
Click + Create and select Create from Scratch.
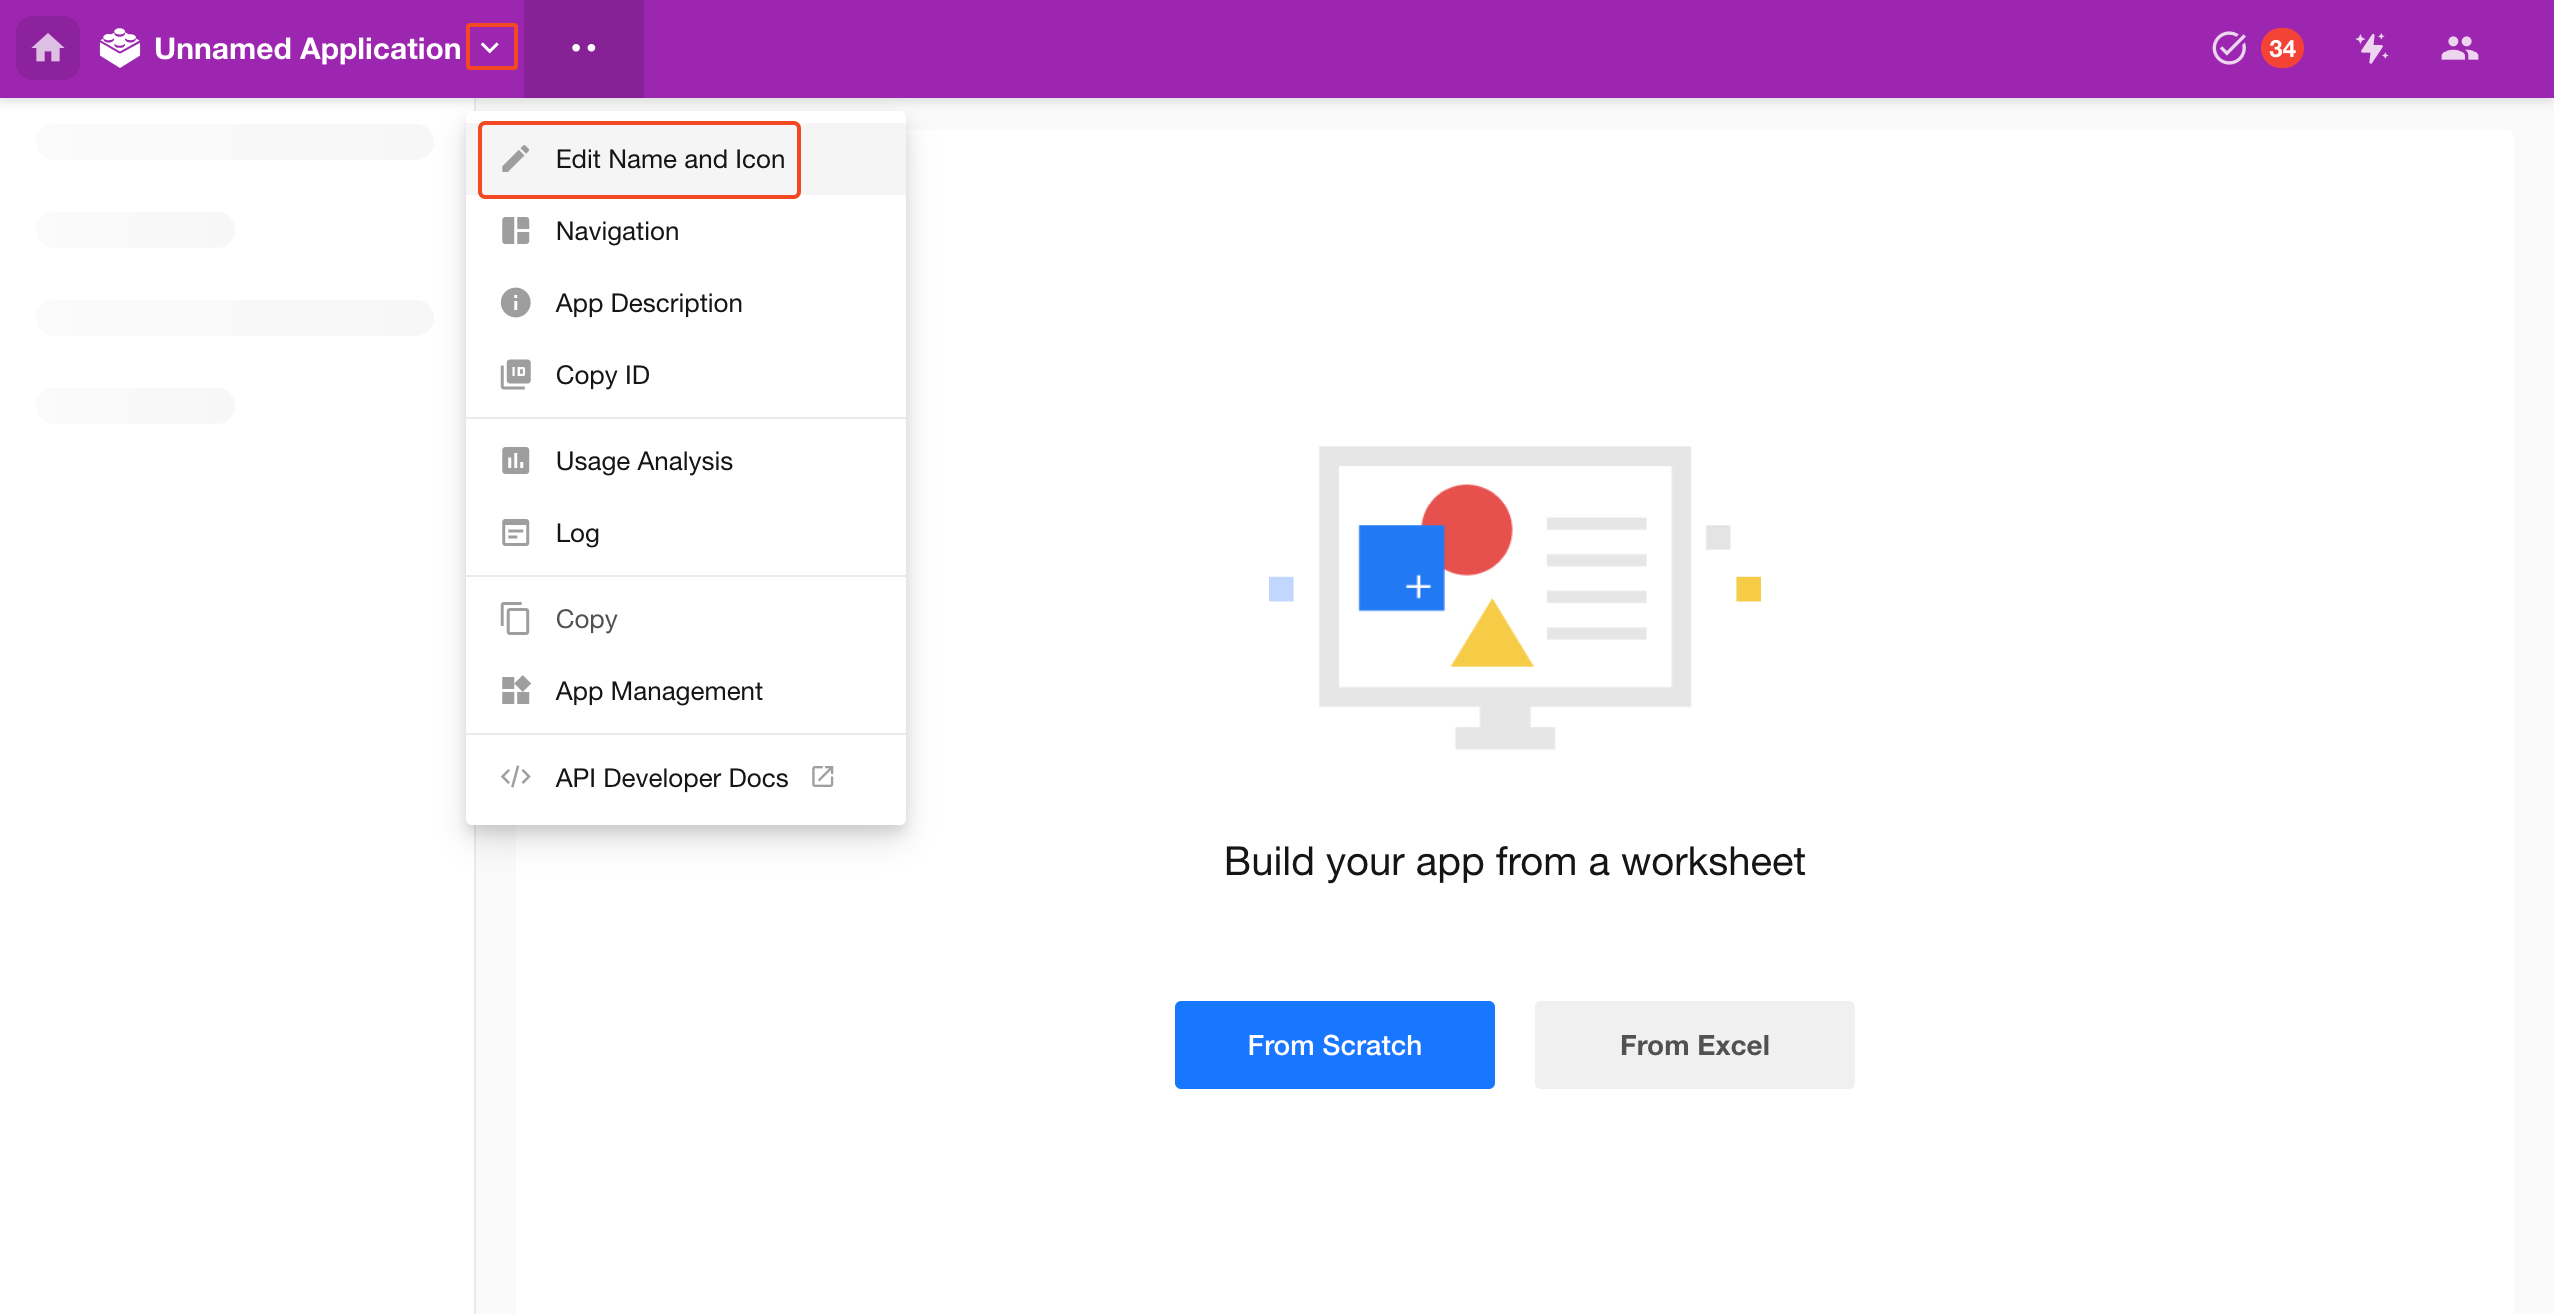
Set the application name, theme color, and icon.
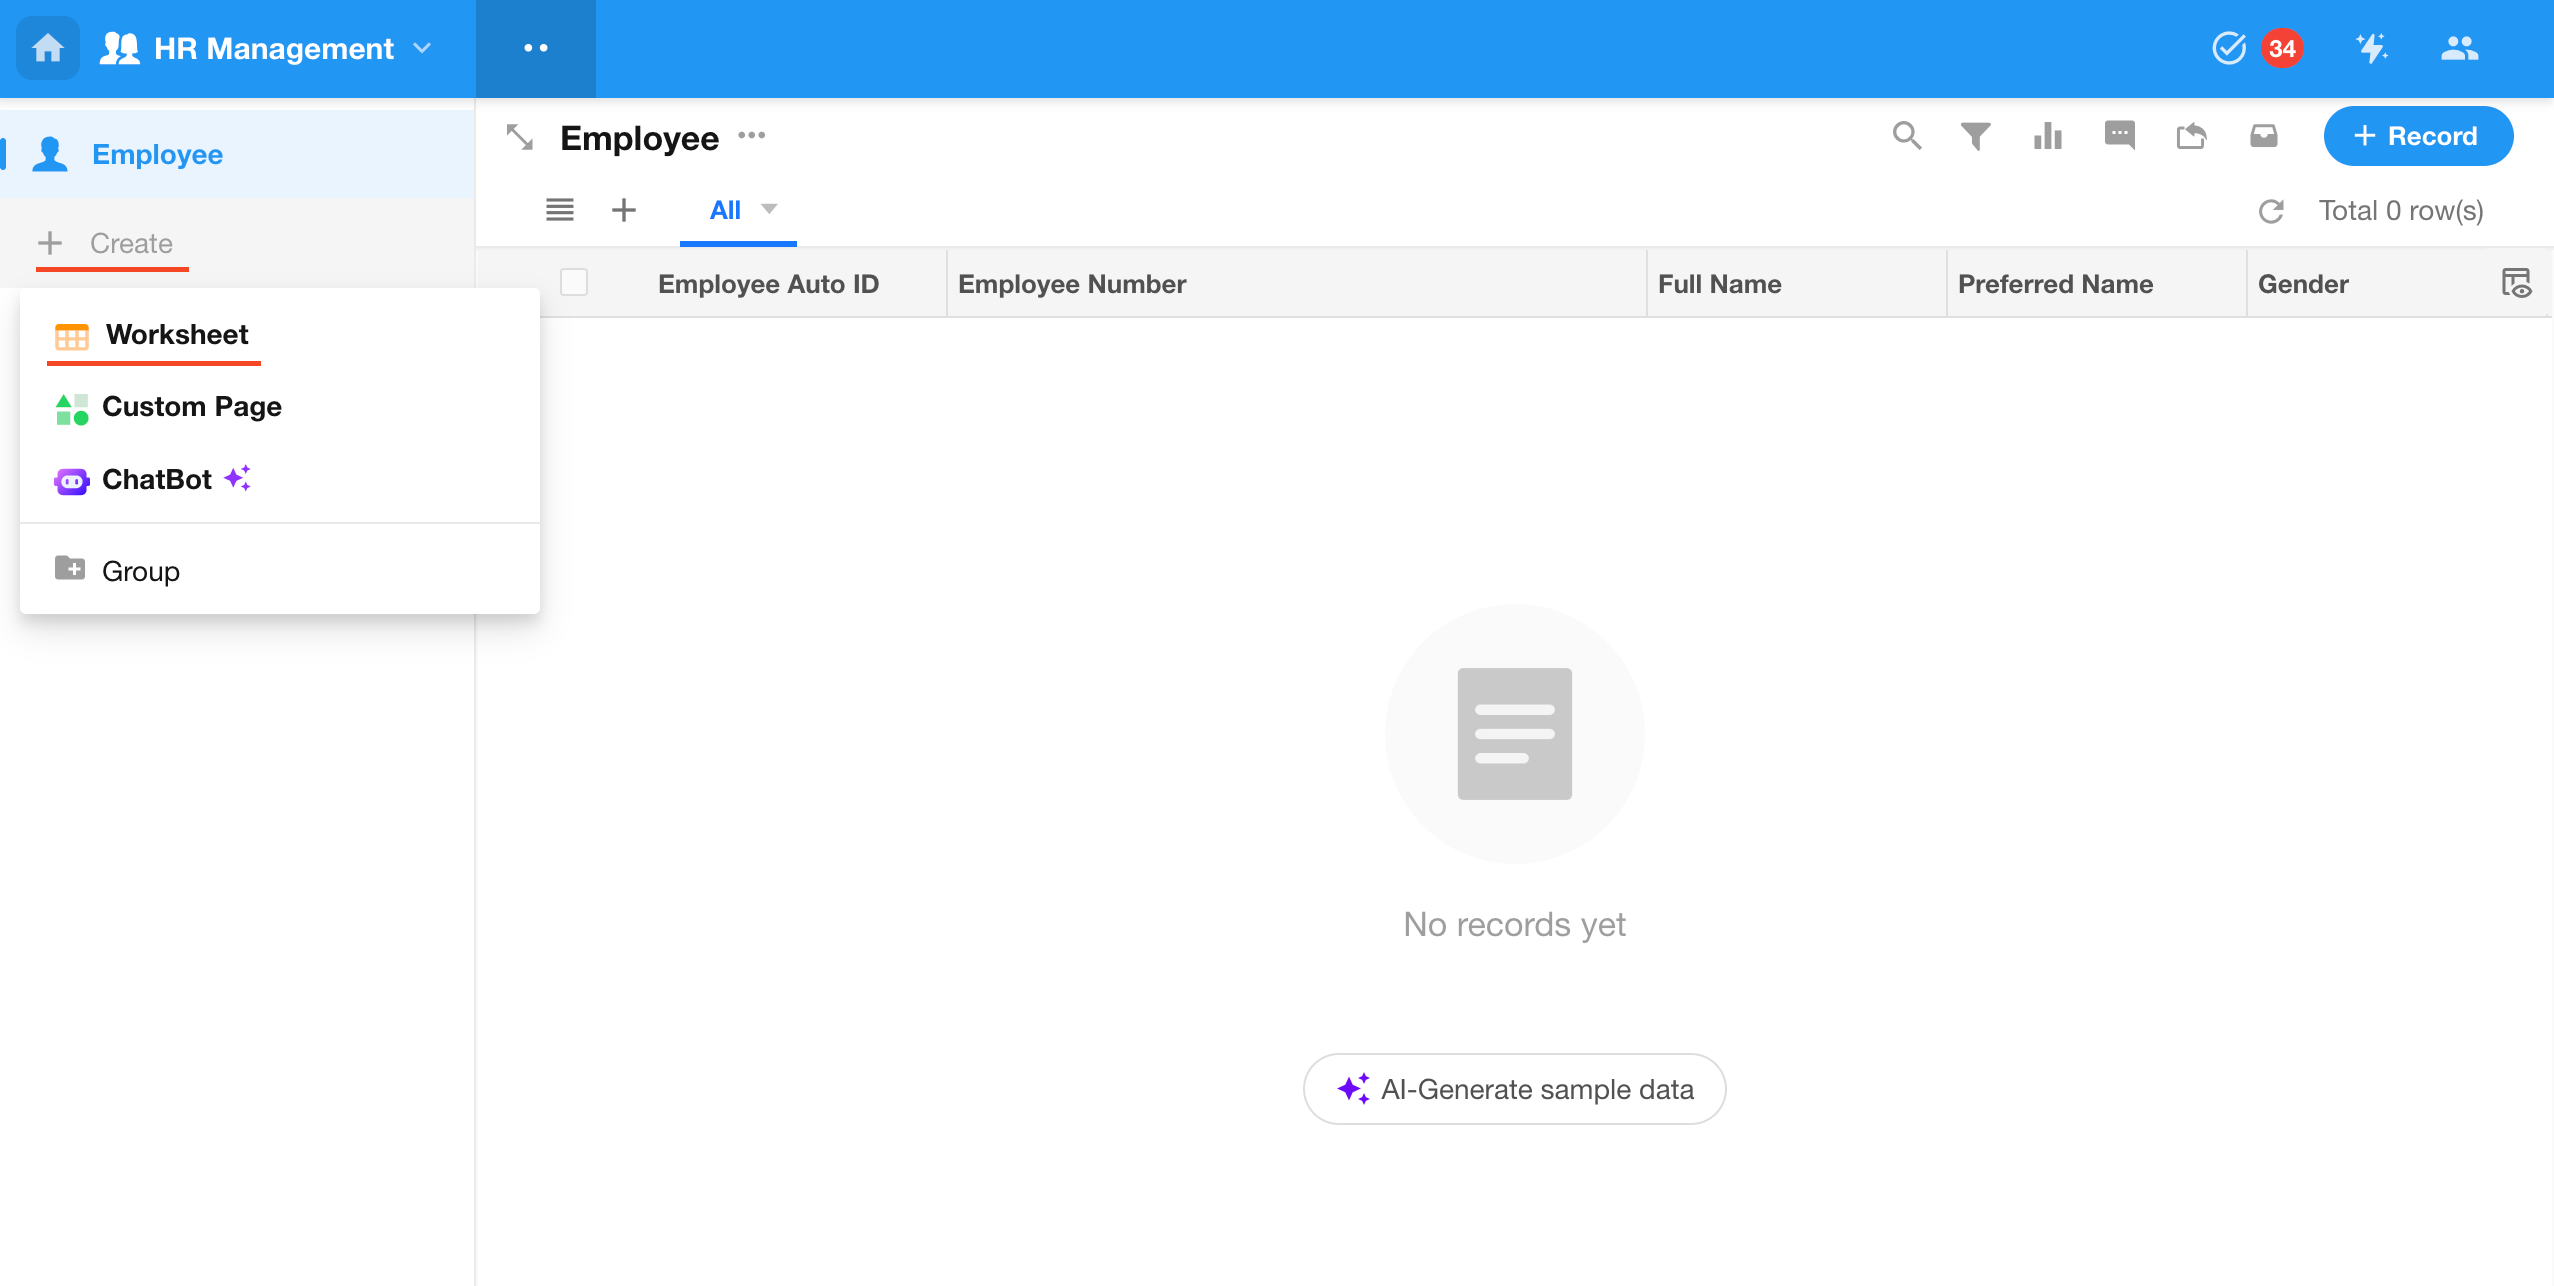
2. Create Worksheets and Custom Pages
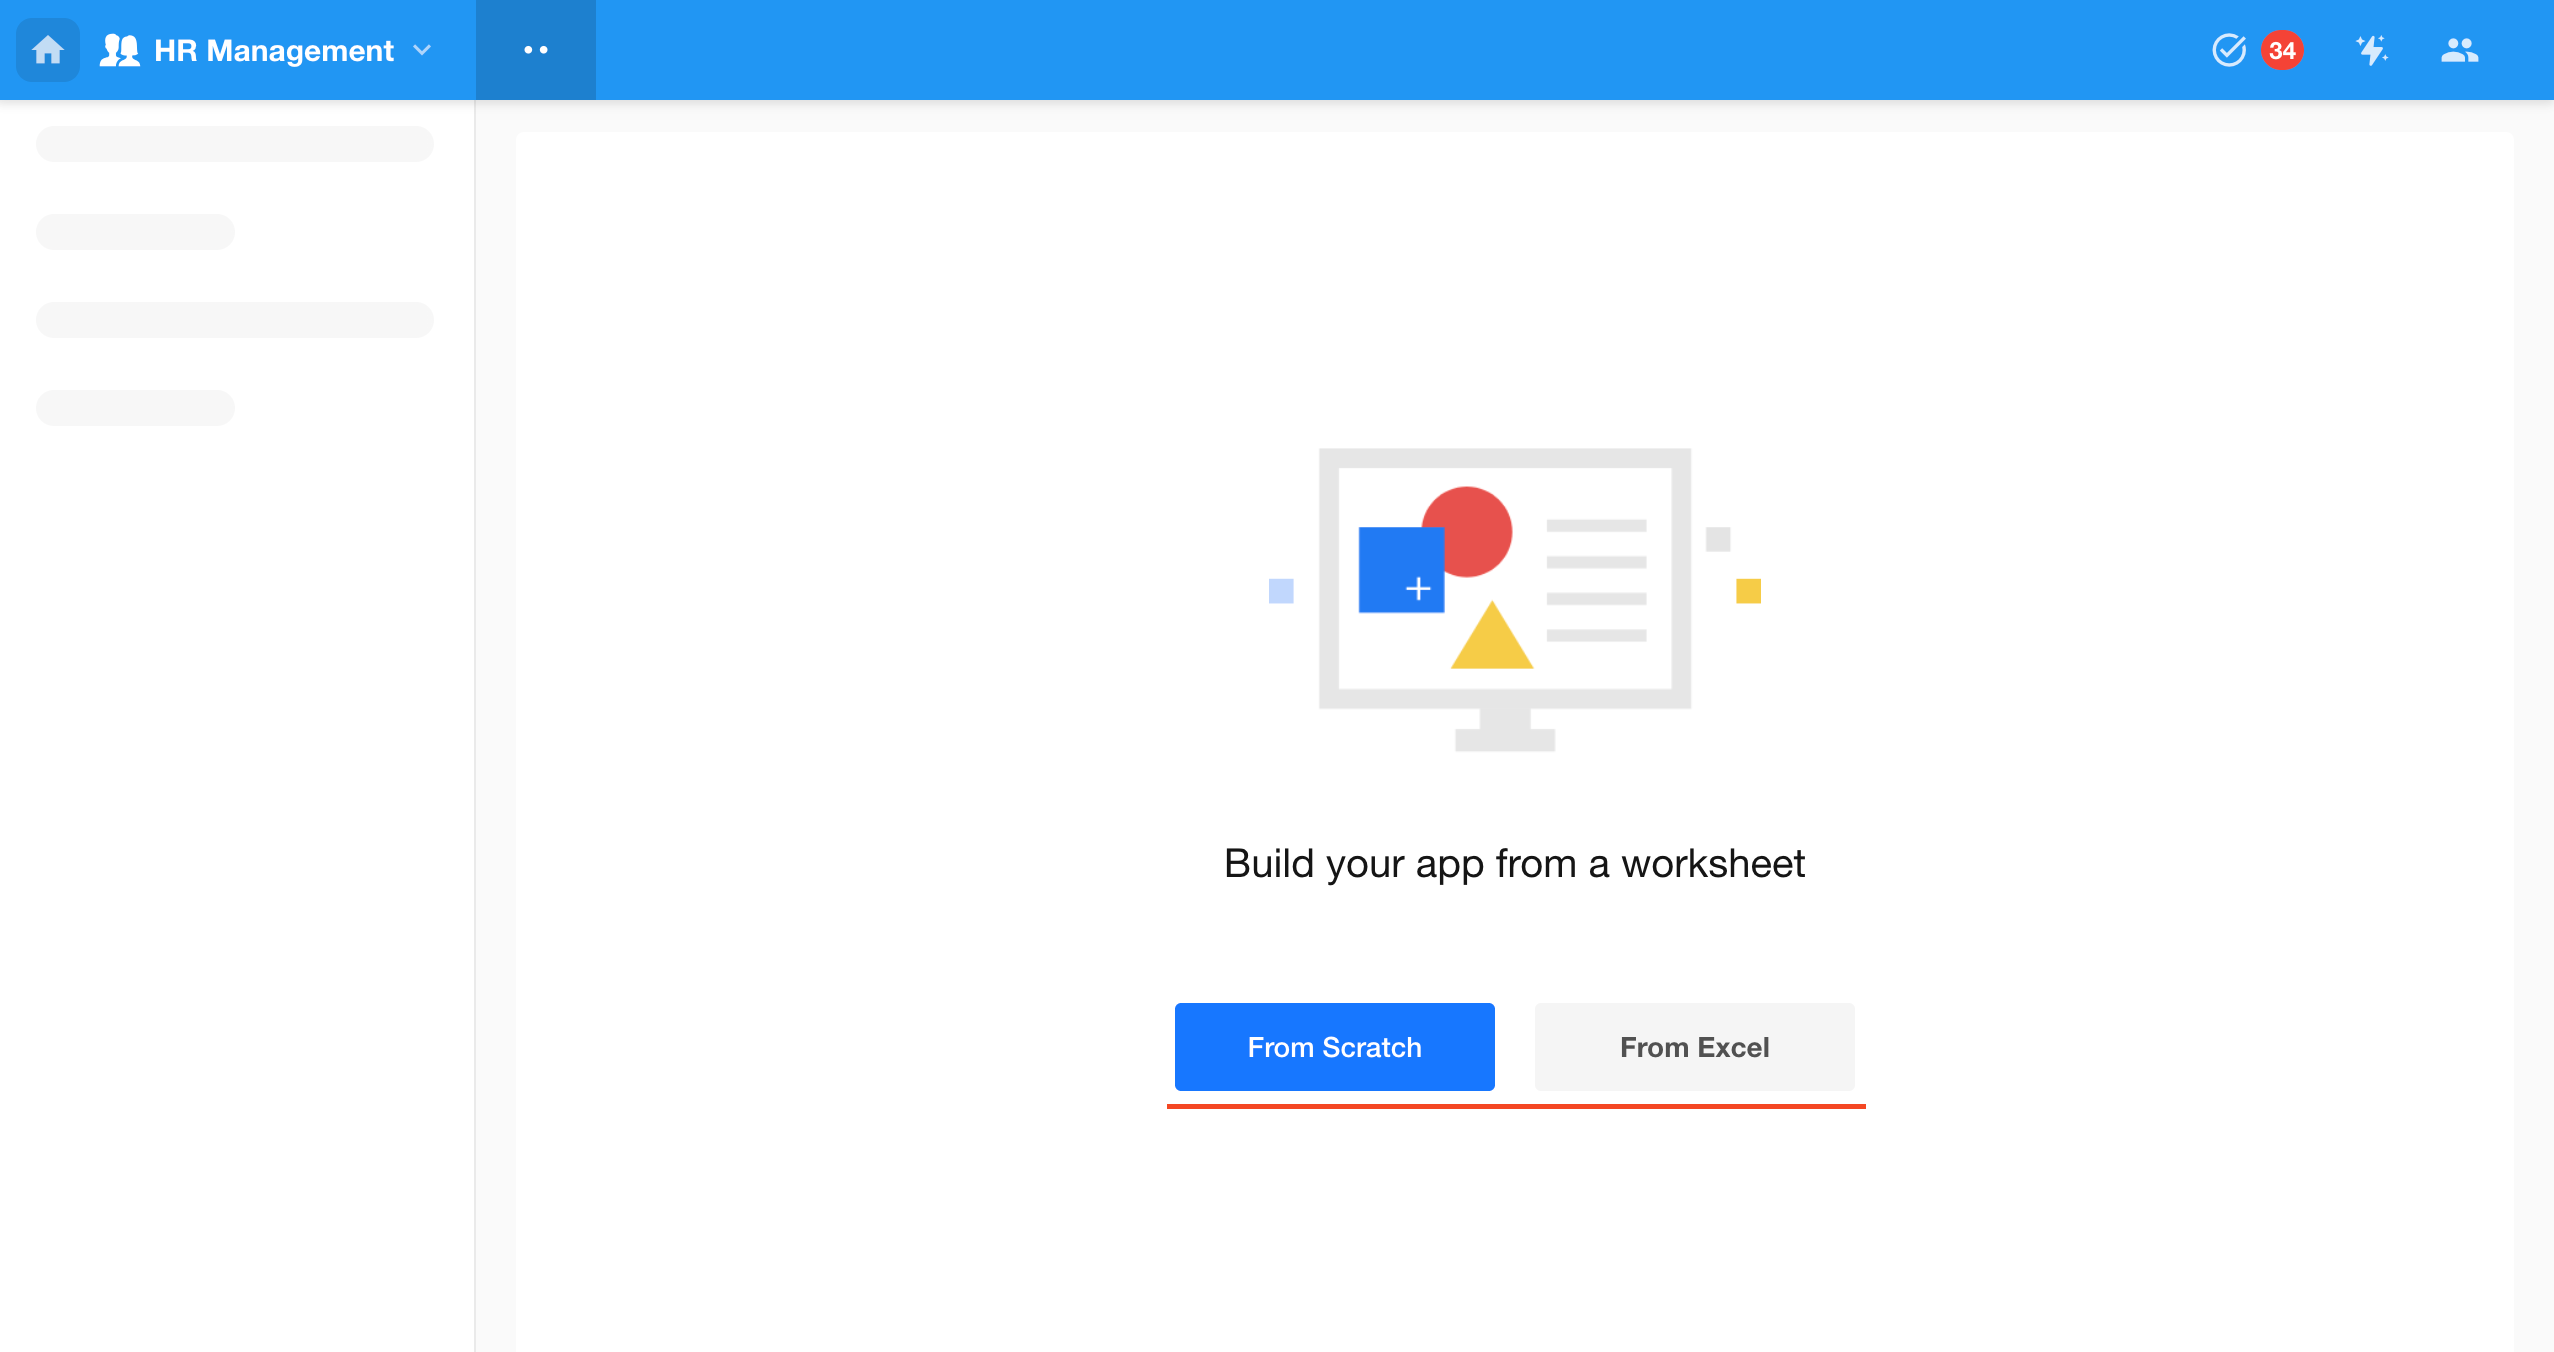
You can create them manually or import from Excel.
Typically, an application consists of multiple worksheets.
Learn how to design worksheets
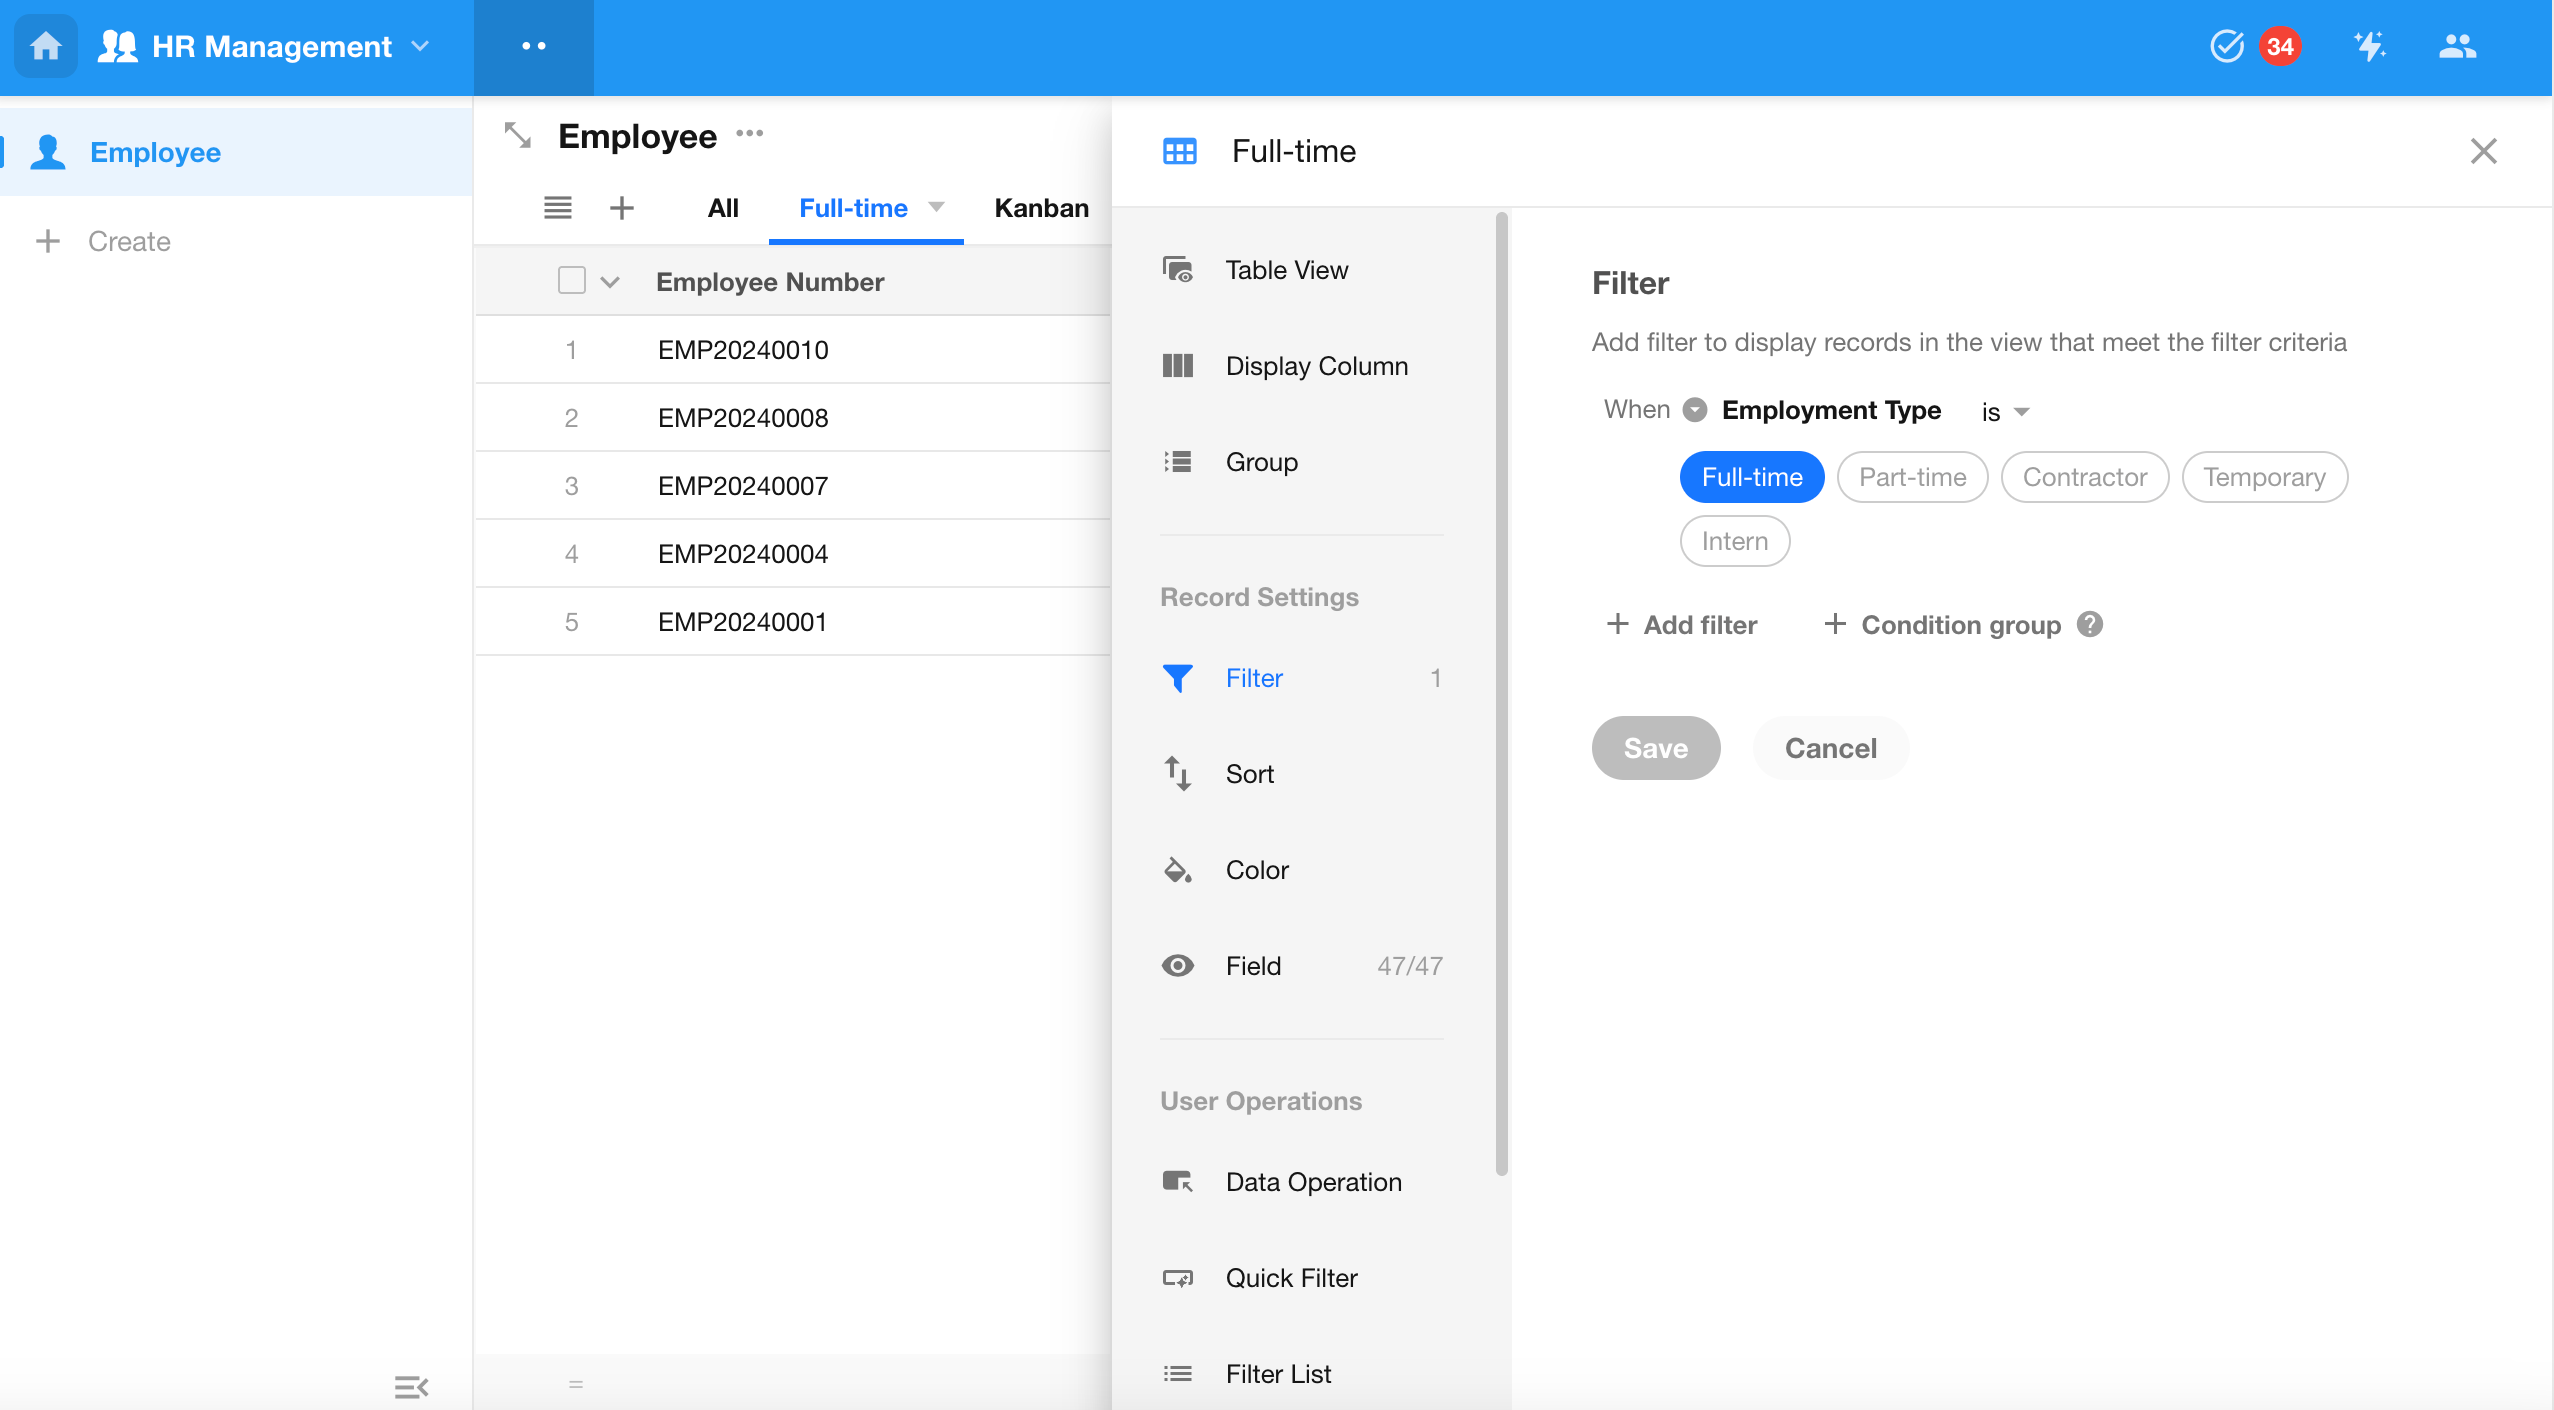
3. Create Views in Worksheets
A view is the interface for presenting filtered worksheet data.
For example, in an Order Management worksheet, you may often need to view “Unpaid” orders. You can create an Unpaid view with a filter condition such as Status = Unpaid.
Each worksheet must have at least one view.
4. Users (Roles and Permissions)
Worksheet data is managed with role-based permissions. For example:
- Some users can create, edit, and delete records
- Some users can only view data
- Some users can only view the records they created
All these scenarios can be configured through roles and permissions.
Role and permission configuration details
5. Workflow
Any rule-based data operation can be automated using workflows, enabling automated business processes and data flow.
HAP provides nearly 50 automation actions to help reduce repetitive manual work.
6. Charts
Data collected in worksheets can be analyzed and visualized using charts.
HAP provides 16 chart types to help you analyze data trends.
By following the steps above, you can build a complete application. In the early stage, focus on worksheets, views, and roles. Workflow and chart configurations can be refined later.
We recommend referring to Getting Started to quickly learn the basics by building a simple recruitment management application.
Was this document helpful?