Treemap
1. Overview
A treemap uses the area of each rectangular block to represent a category's proportion of the whole. The larger the proportion, the larger the corresponding block.
Treemaps are useful for visualizing metrics such as the proportion of orders contributed by each sales region or the share of total revenue generated by each product category.
Common Use Cases:
- Sales Revenue Breakdown: View the contribution of each product category to total sales revenue and identify the main sources of revenue.
- Expense Breakdown: See how much each expense category, such as labor, travel, and procurement, contributes to total expenses.
- Inventory Value Distribution: Compare the proportion of total inventory value held by each product category to identify where most inventory capital is concentrated.
2. Example: Compare Order Amounts Across Sales Regions
Using a Sales Orders worksheet as an example, create a new chart and configure the data source using View, Time, and Permissions. Select Treemap as the chart type, then configure the following options:
| Setting | Example | Description |
|---|---|---|
| Block Label (Dimension) | Sales Region | Groups the data by sales region, with each block representing one region. |
| Block Size (Value) | Amount | Calculates the order amount for each region and determines the block area based on its proportion of the total. |
As shown below, the South China region has the largest block, accounting for 31.75% of the total order amount in the selected dataset.
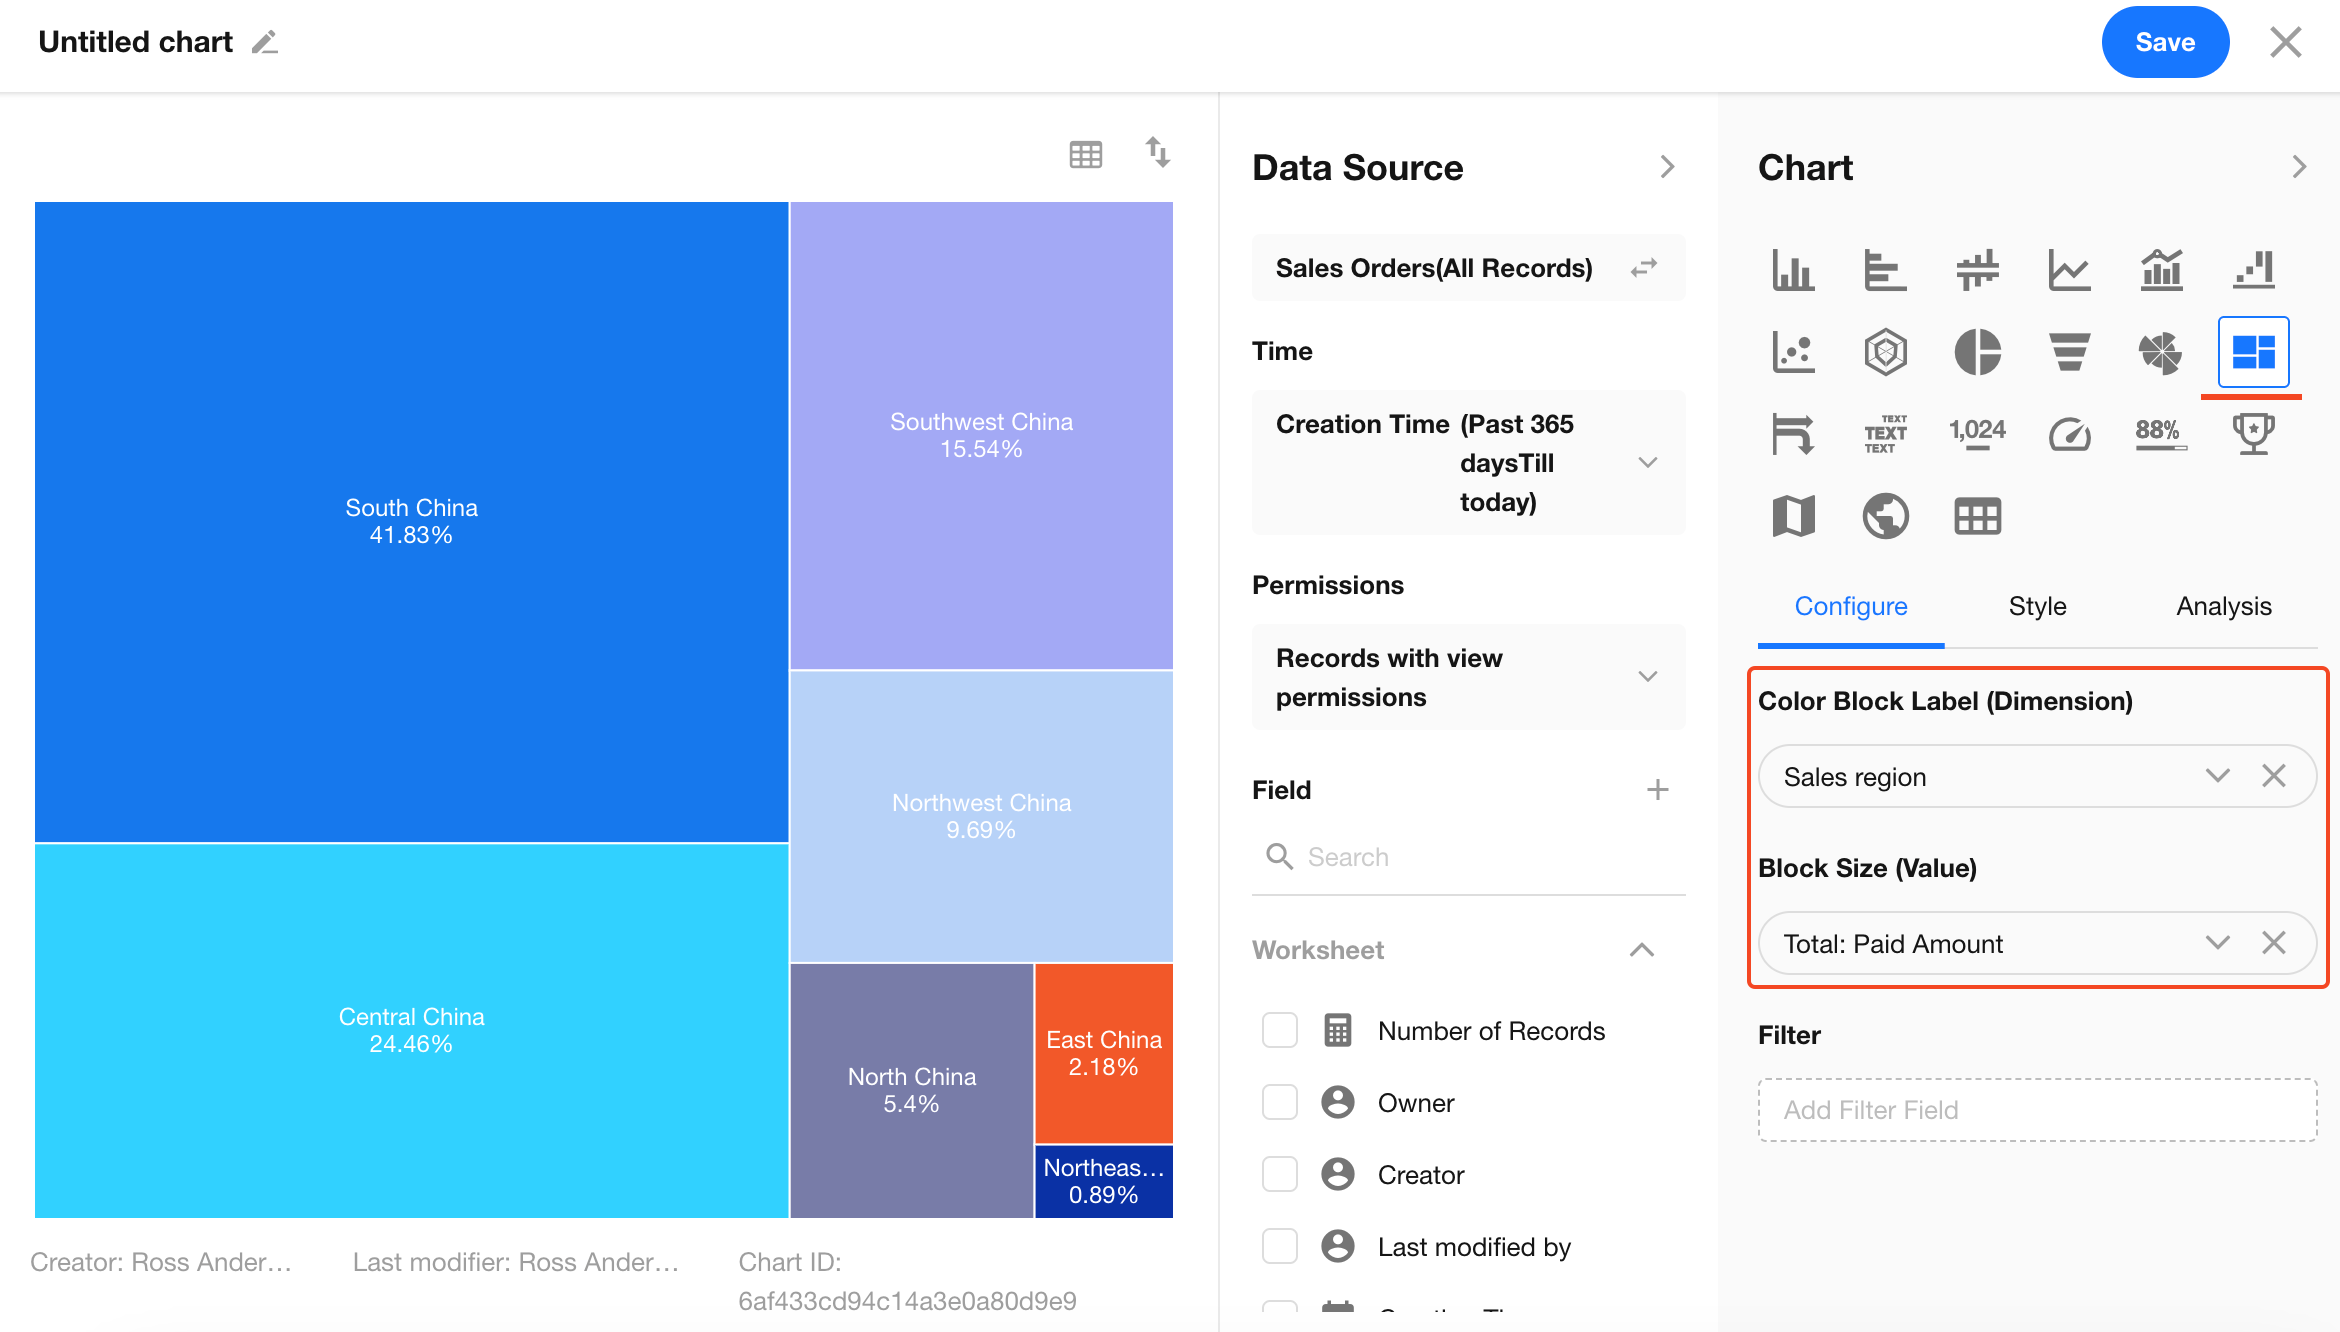
Once you are satisfied with the preview, save the chart.
For more information about creating charts and configuring filters and styles, see Chart Configuration and Usage Guide.
Was this document helpful?