Rose Chart
1. Overview
Rose charts are useful for comparing values across different categories, such as order volumes across sales regions. The larger the value, the farther the corresponding sector extends from the center of the chart.
Common Use Cases:
- Compare Order Volumes Across Regions: Compare order volumes across sales regions. You can also group data by sales representative to see how many orders each representative handles within a region.
- Compare Lead Sources: Compare the number of leads generated through different channels, such as your website, trade shows, and partner referrals.
- Compare Ticket Categories: Compare the number of tickets across categories, such as usage inquiries, bug reports, and feature requests, to identify the most common issues.
2. Example: Compare Order Volumes Across Sales Regions
Using a Sales Orders worksheet as an example, this tutorial shows how to compare total order volumes across sales regions and then break down the results by sales representative.
Step 1: Count Orders by Sales Region
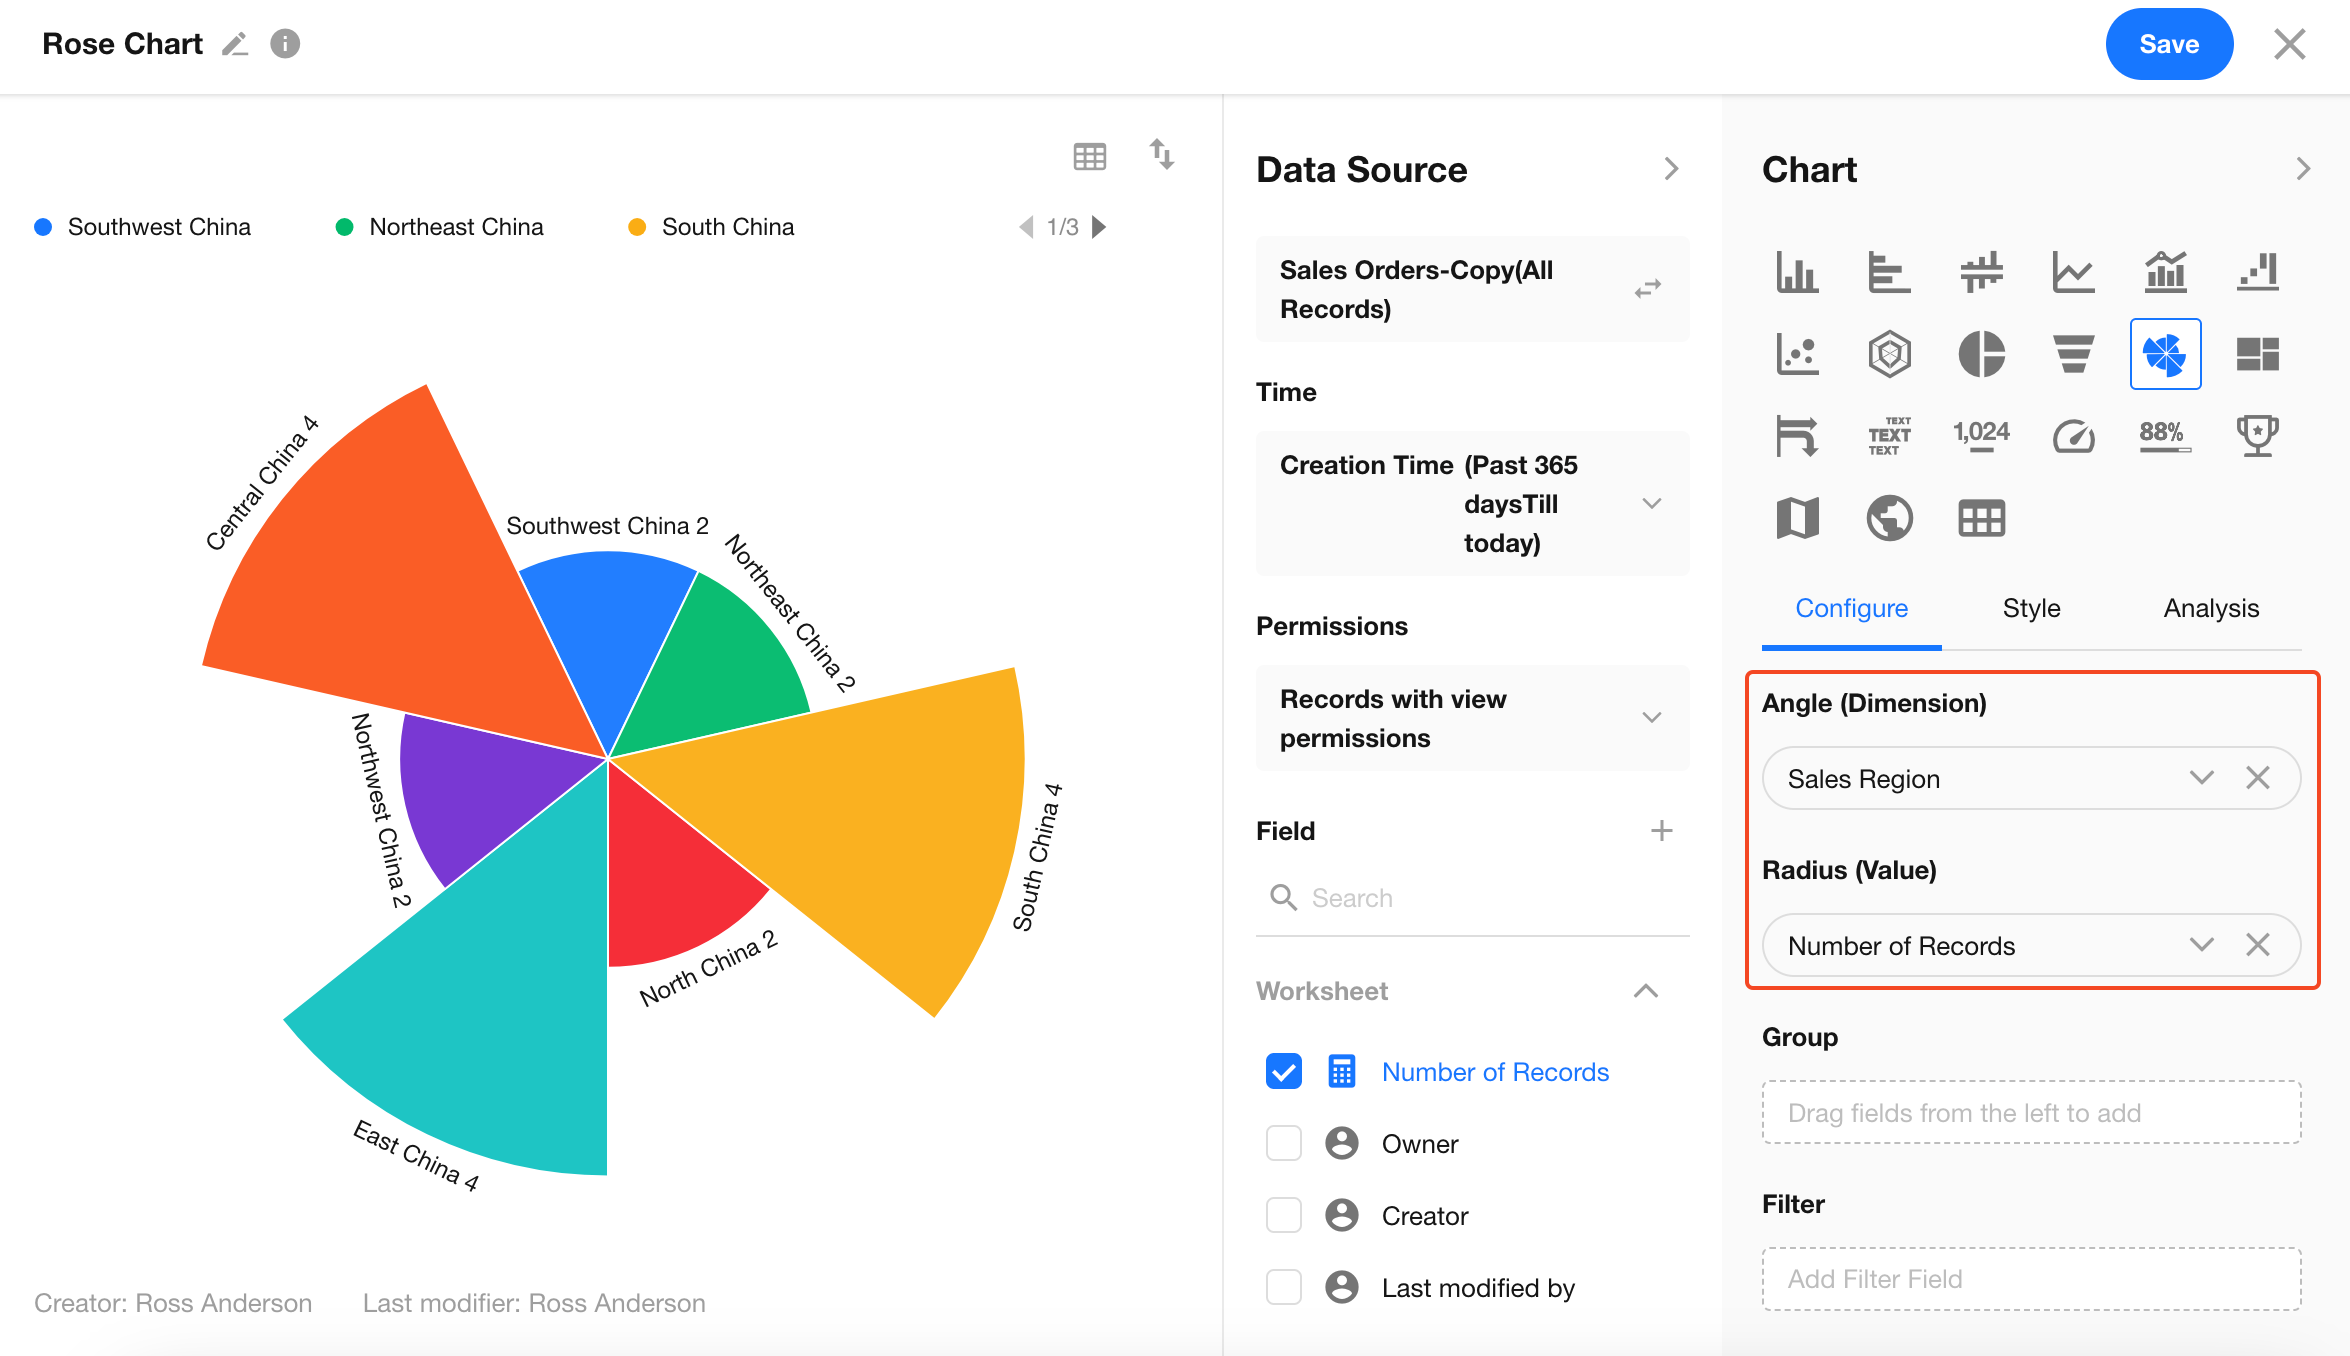
Create a new chart. Select the data source by configuring the View, Time, and Permissions settings, then select Rose Chart as the chart type.
Under Configure, set the following options:
| Setting | Example | Description |
|---|---|---|
| Angle (Dimension) | Sales Region | Determines which field is used to group the data. In this example, orders are grouped by sales region. |
| Radius (Value) | Record Count | Counts the orders in each sales region and represents the count using the sector radius. |
Each sector now represents a sales region and displays its total order count.
Step 2: Break Down Orders by Sales Representative (Optional)
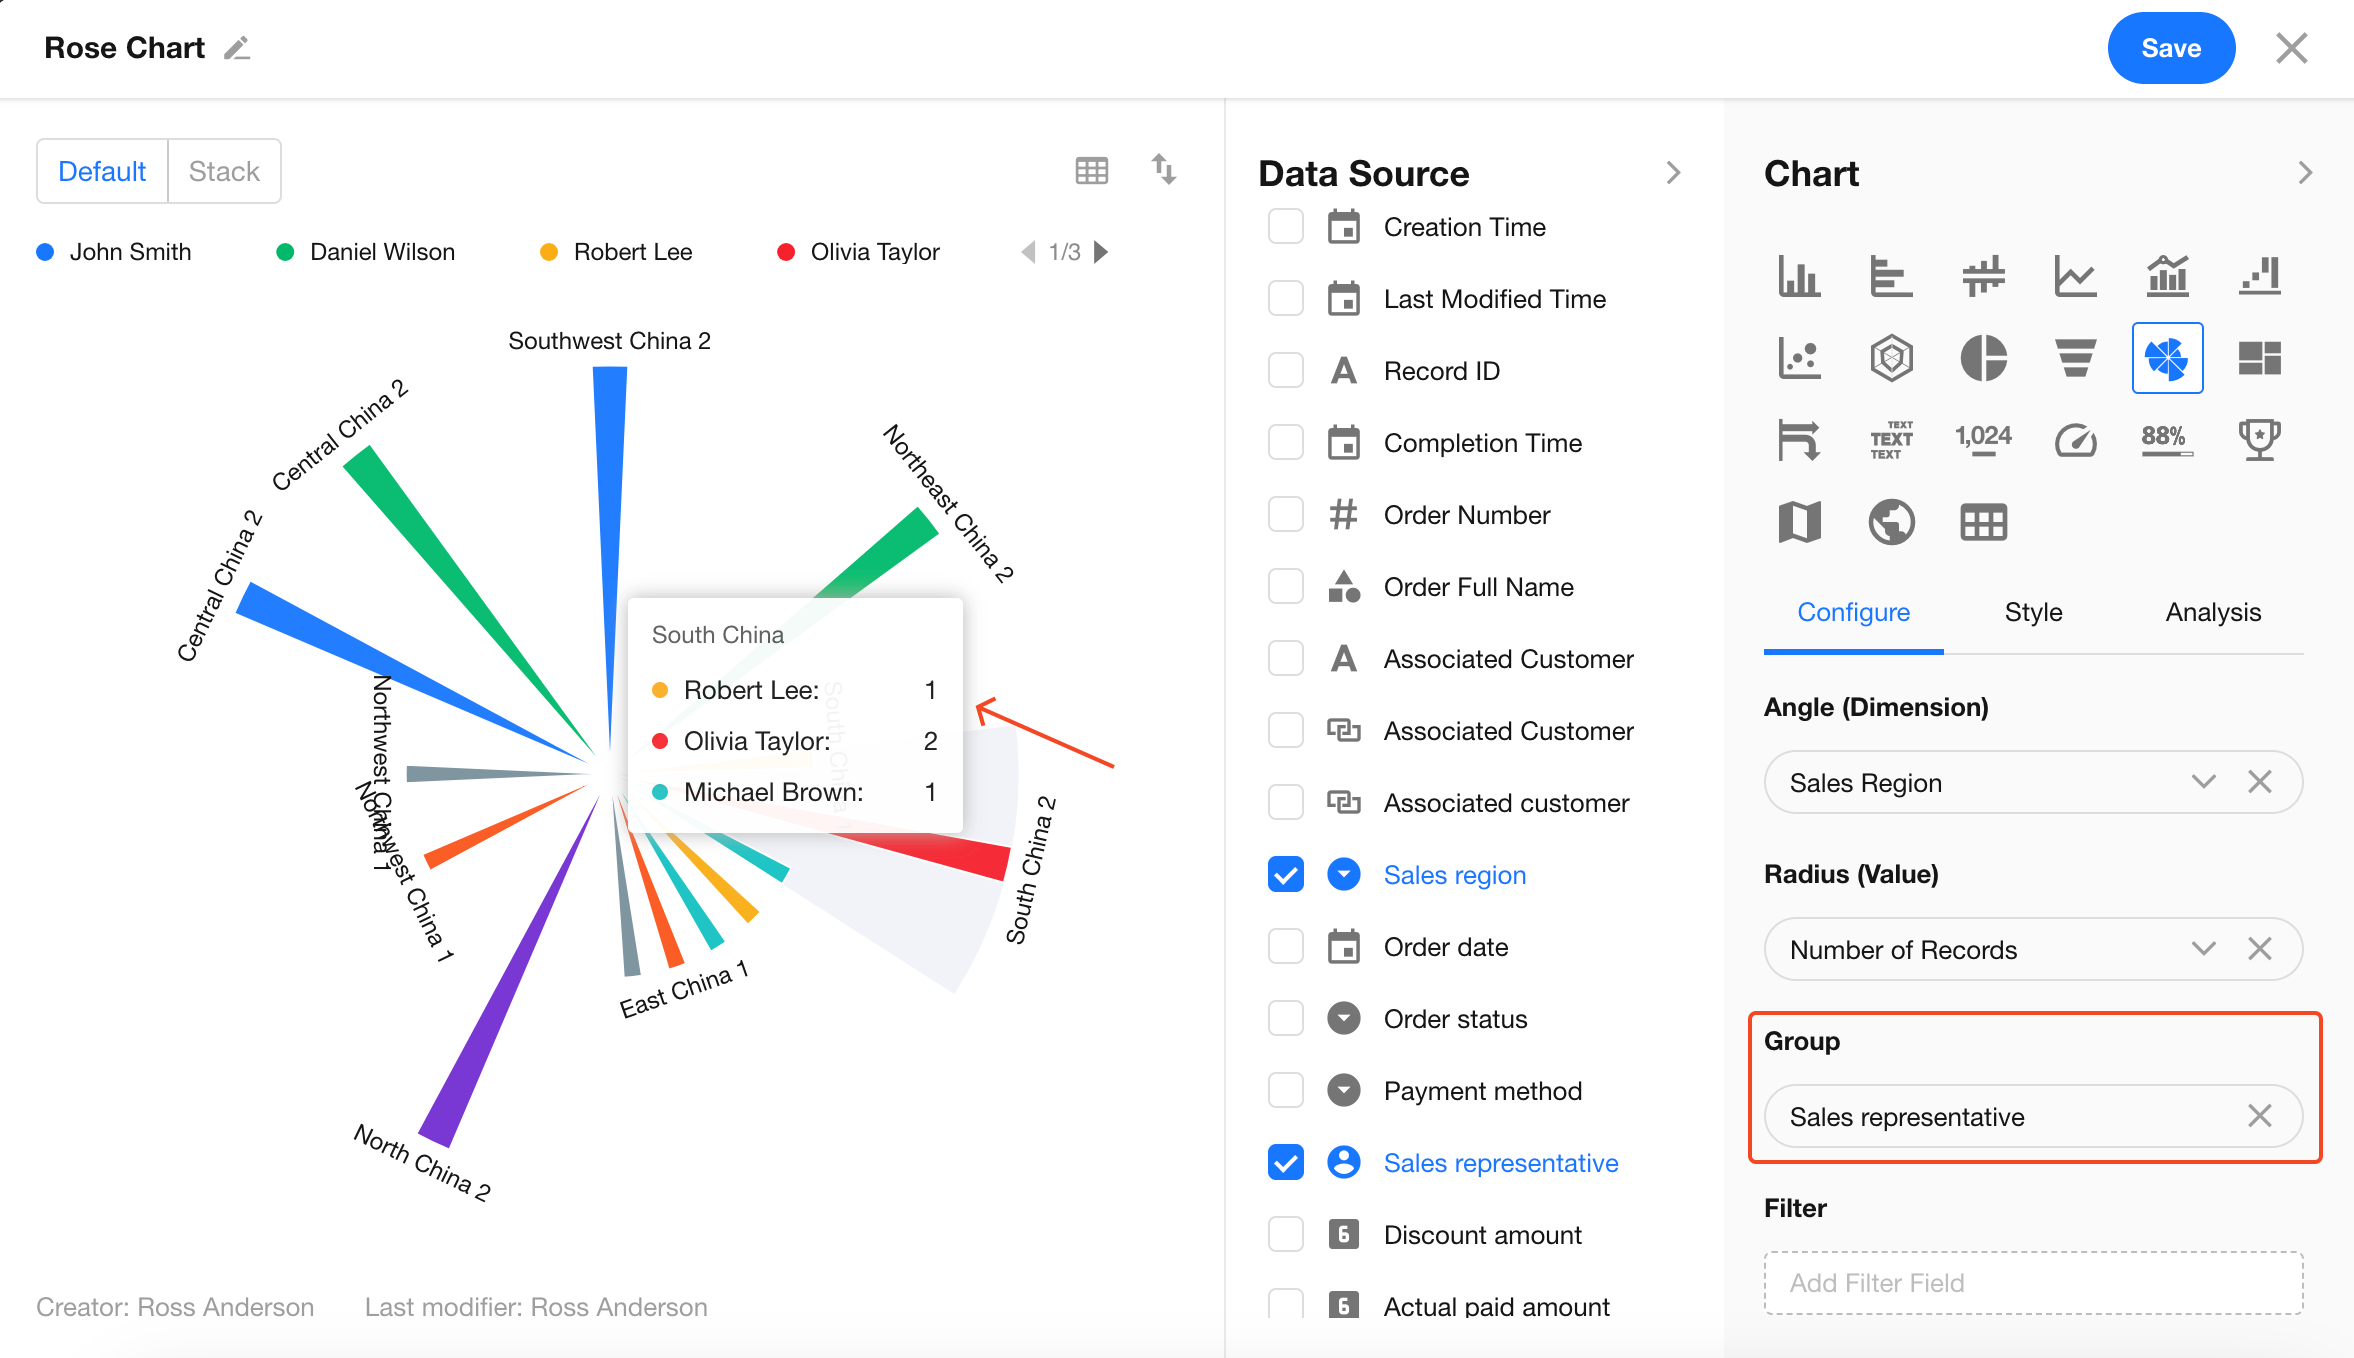
Under Group, select the Sales Representative field to further break down the order count by representative within each sales region.
With the Default display option, different colors represent different sales representatives.
Once you are satisfied with the preview, save the chart.
For more information about creating charts and configuring filters and styles, see Chart Configuration and Usage Guide.
Was this document helpful?