Ranking List
A ranking list displays the distribution and rank order of a metric across a given dimension, typically showing the top N items in descending order.
Below is an example of how to create a ranking list.
Example: Create a ranking list in the Resident Population worksheet to rank cities by population
Data Scope: Select the "Current Year Census" view in the Resident Population worksheet
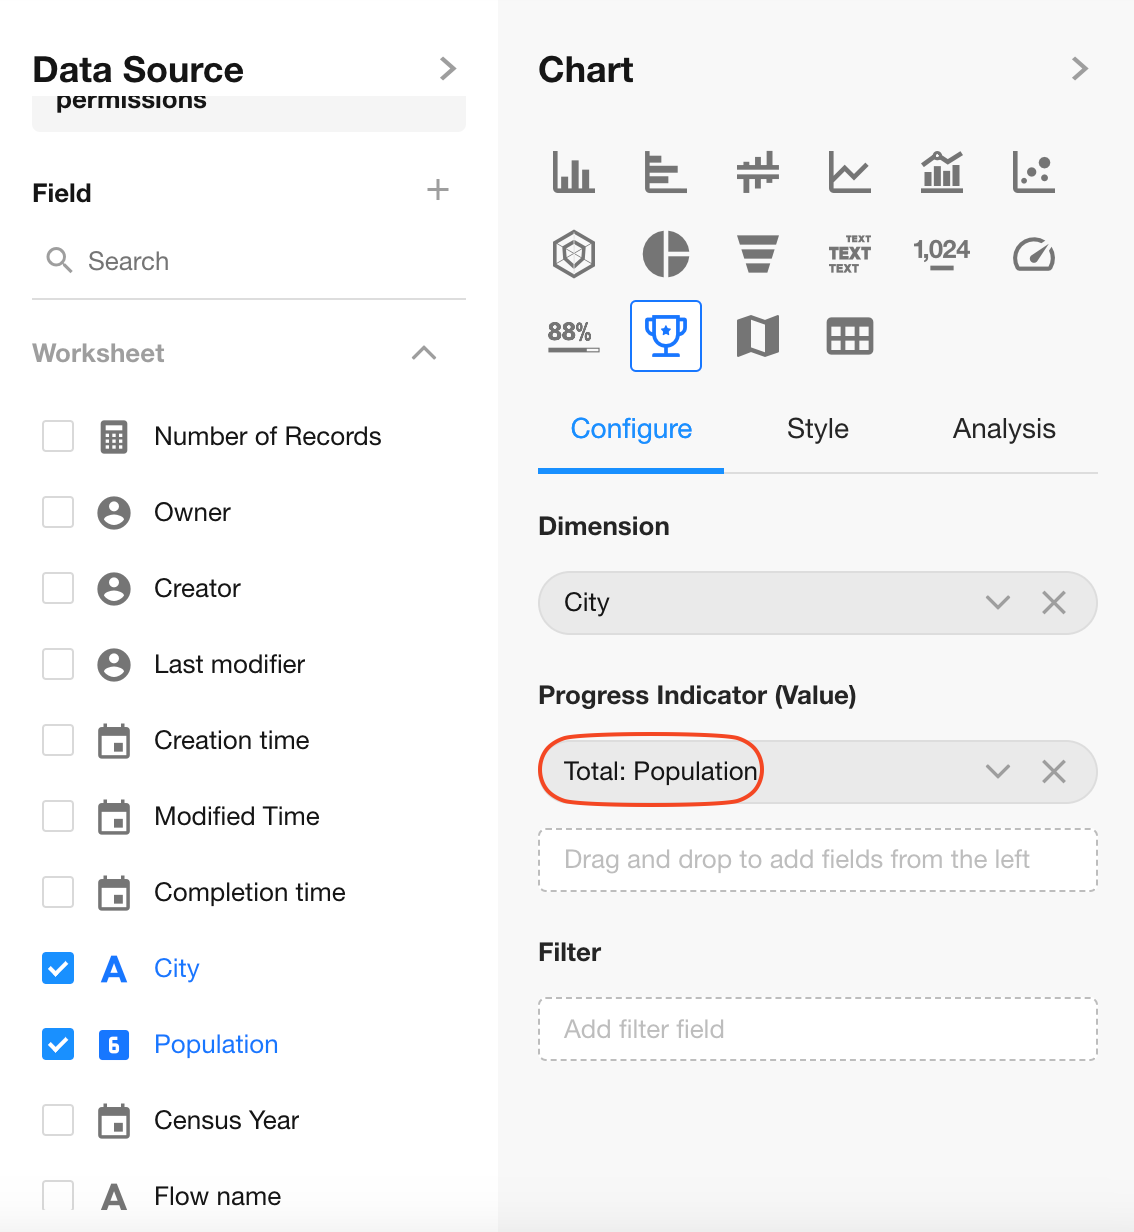
Dimension: Select the City field
Value (Indicator): Select the Population field
Chart Configuration
1. Create a New Chart
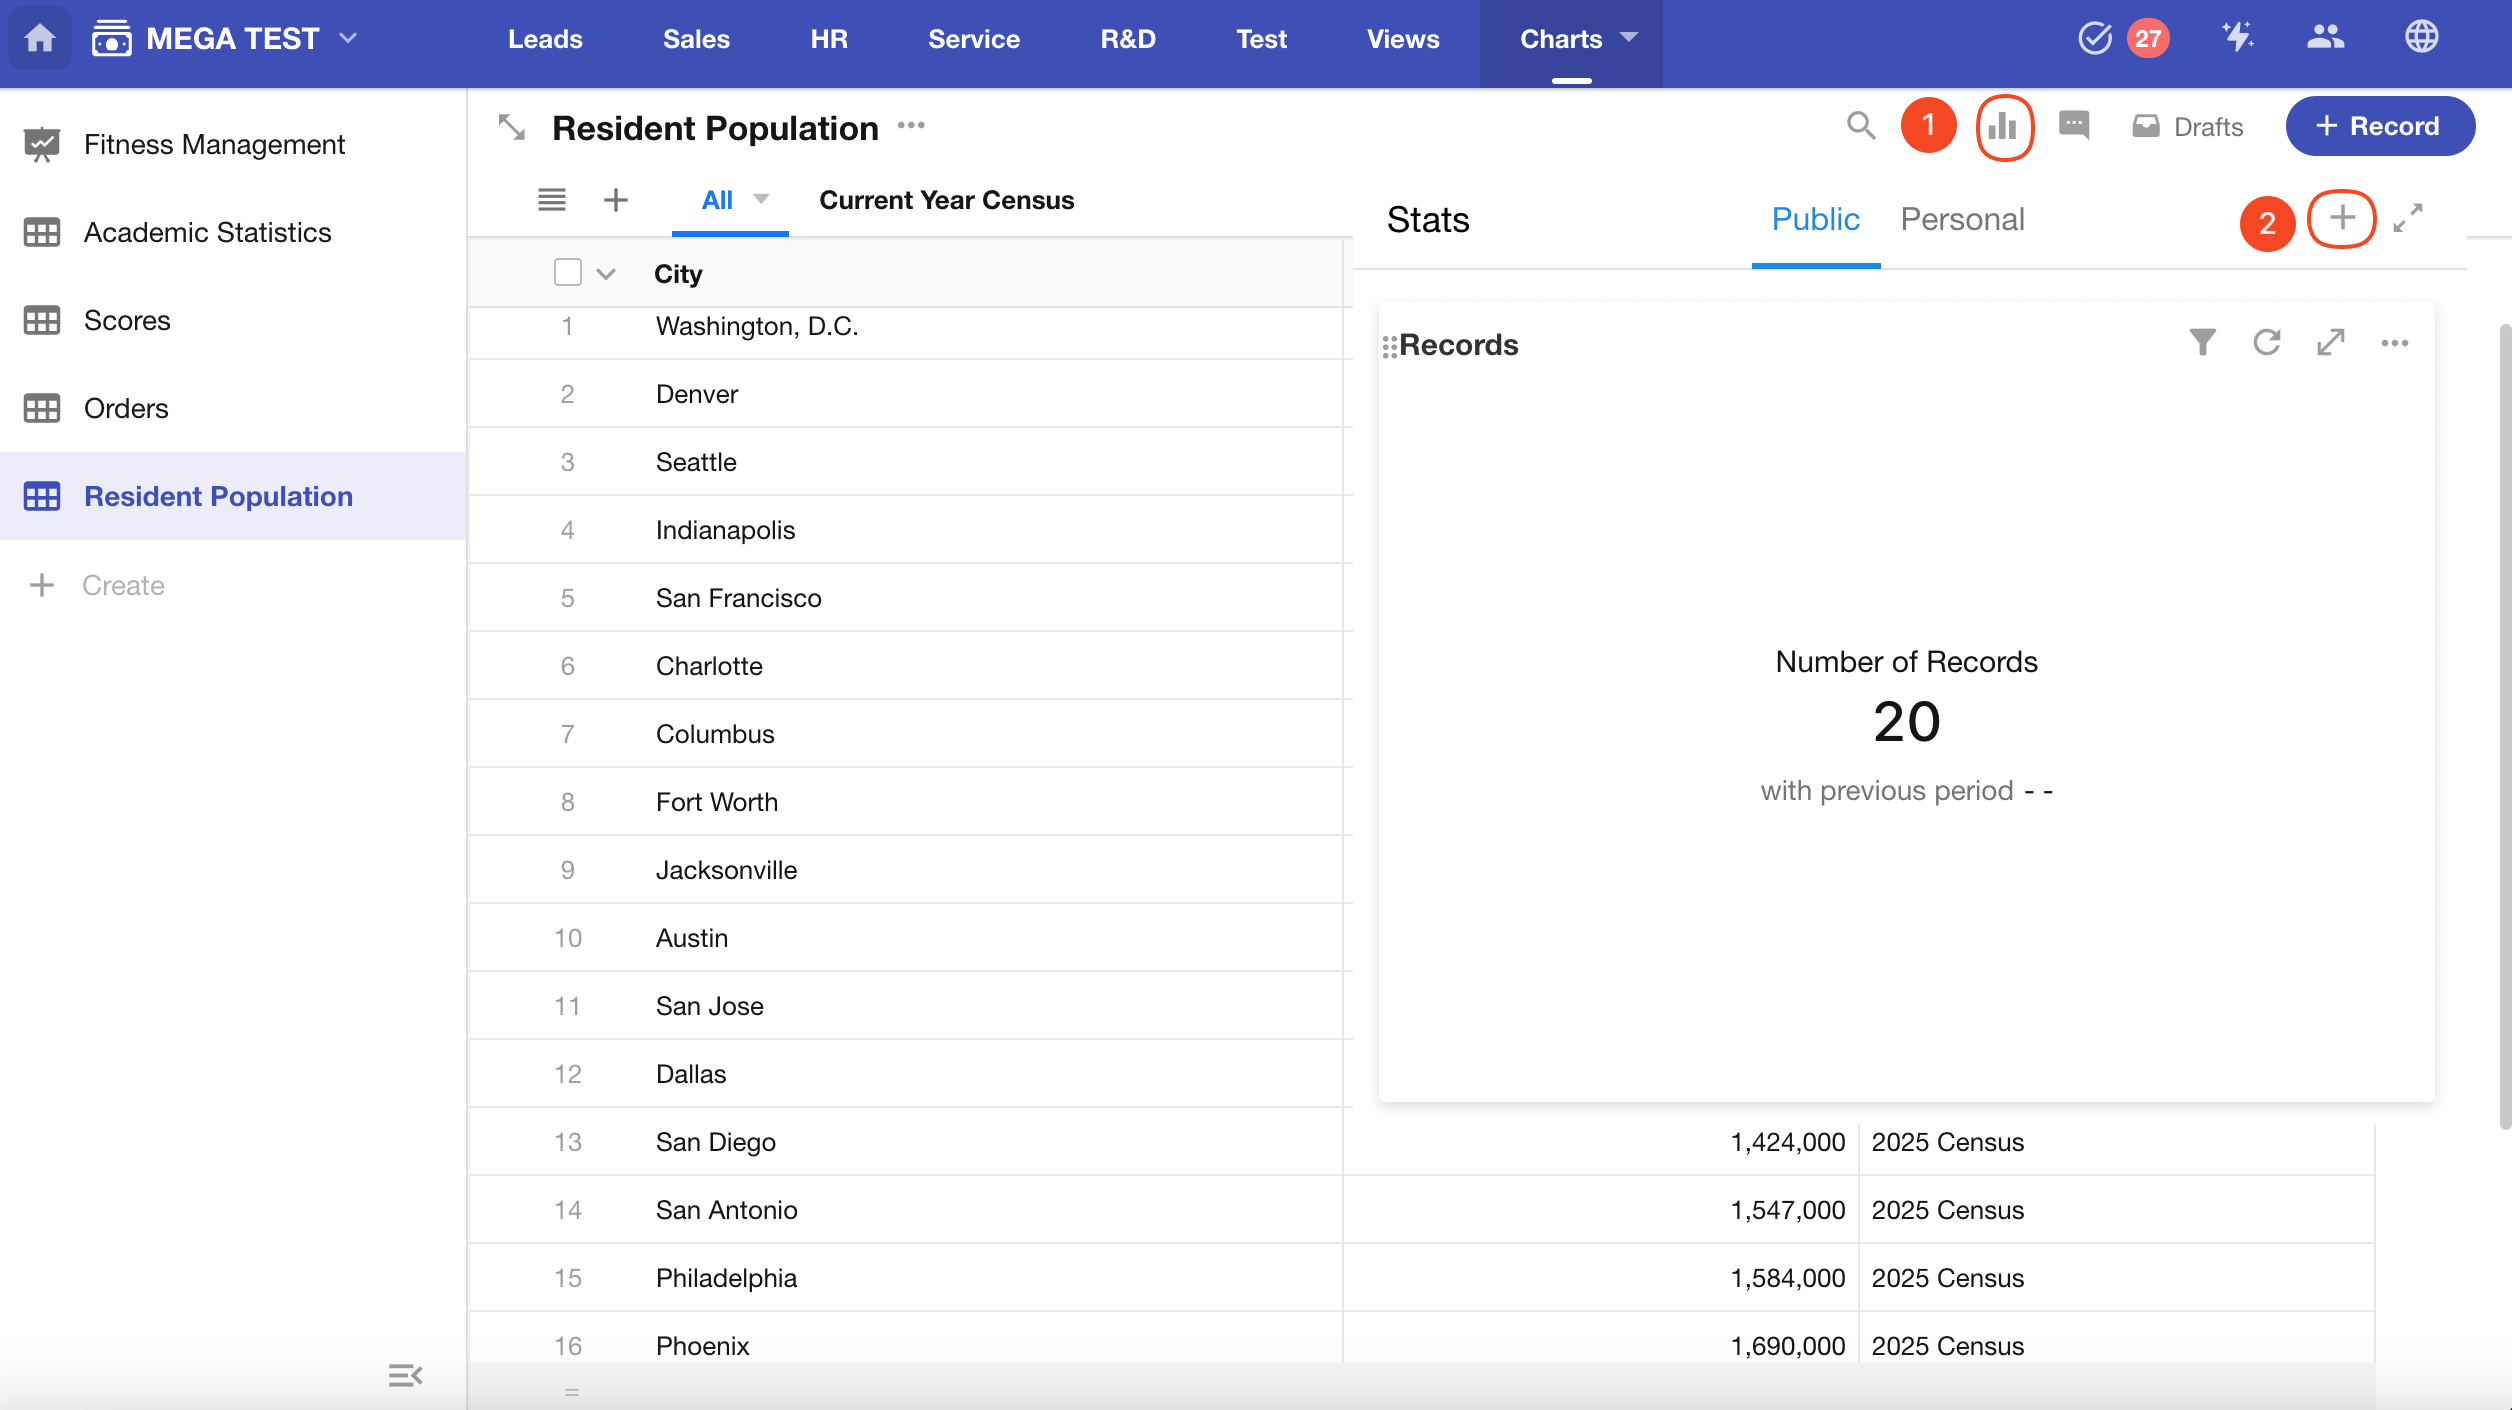
2. Define the Record Scope
Choose whether to use a specific view or all records (default).
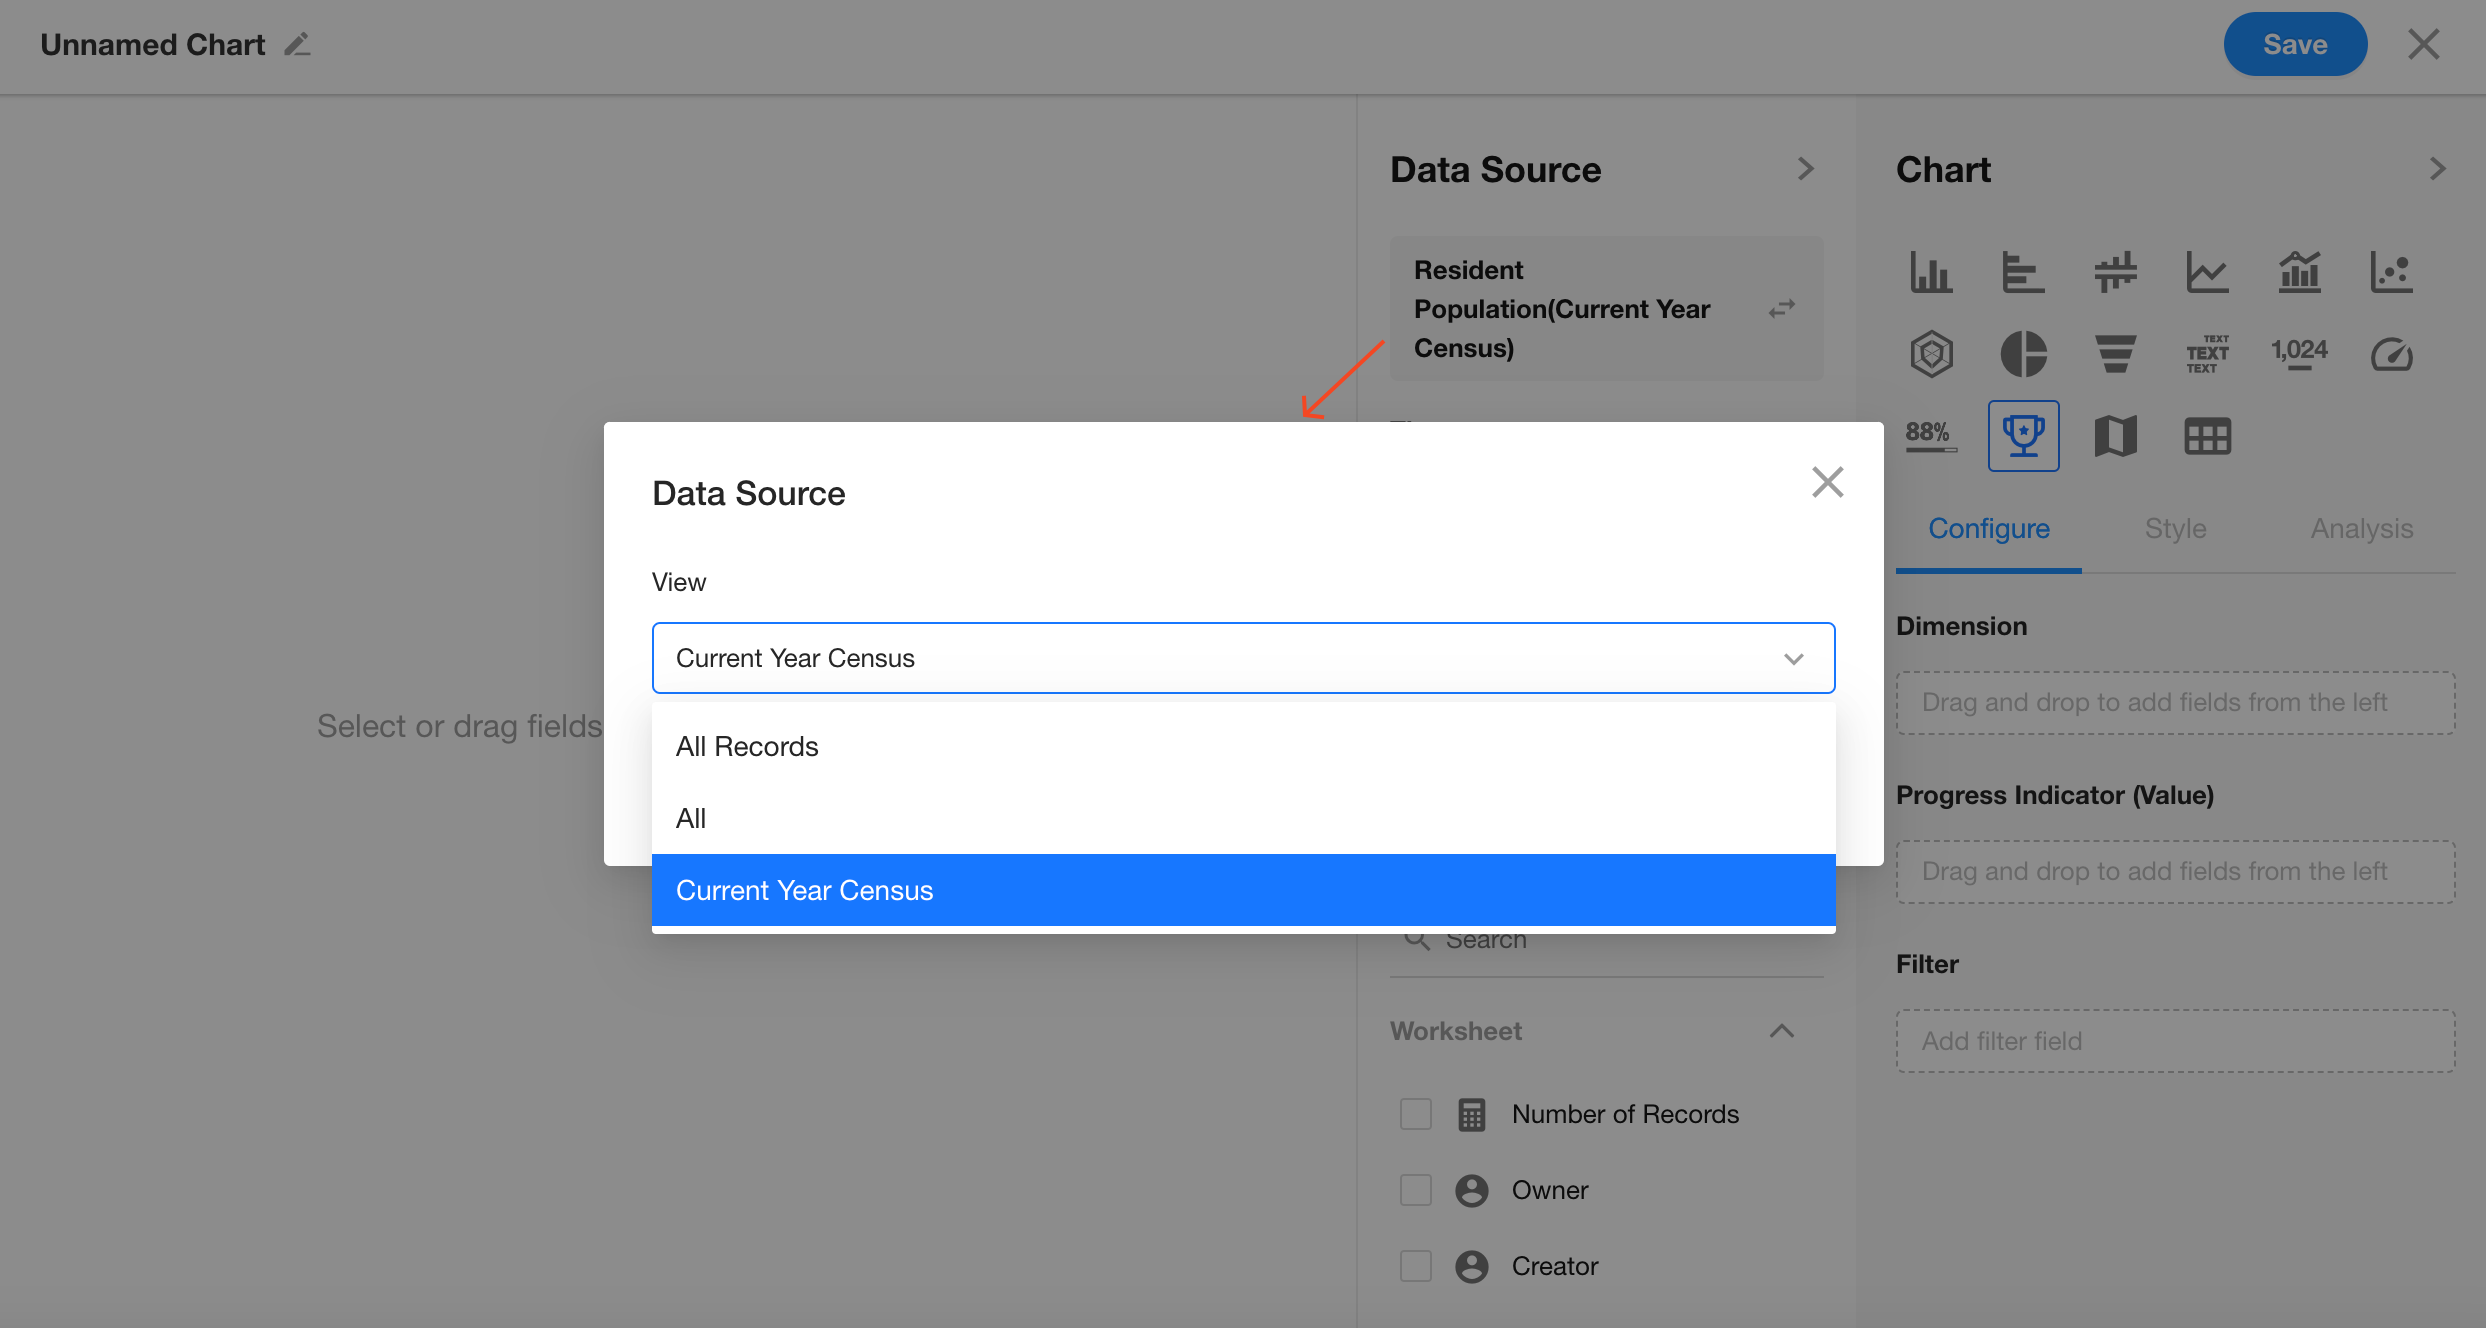
In this example, select the Current Year Census view.
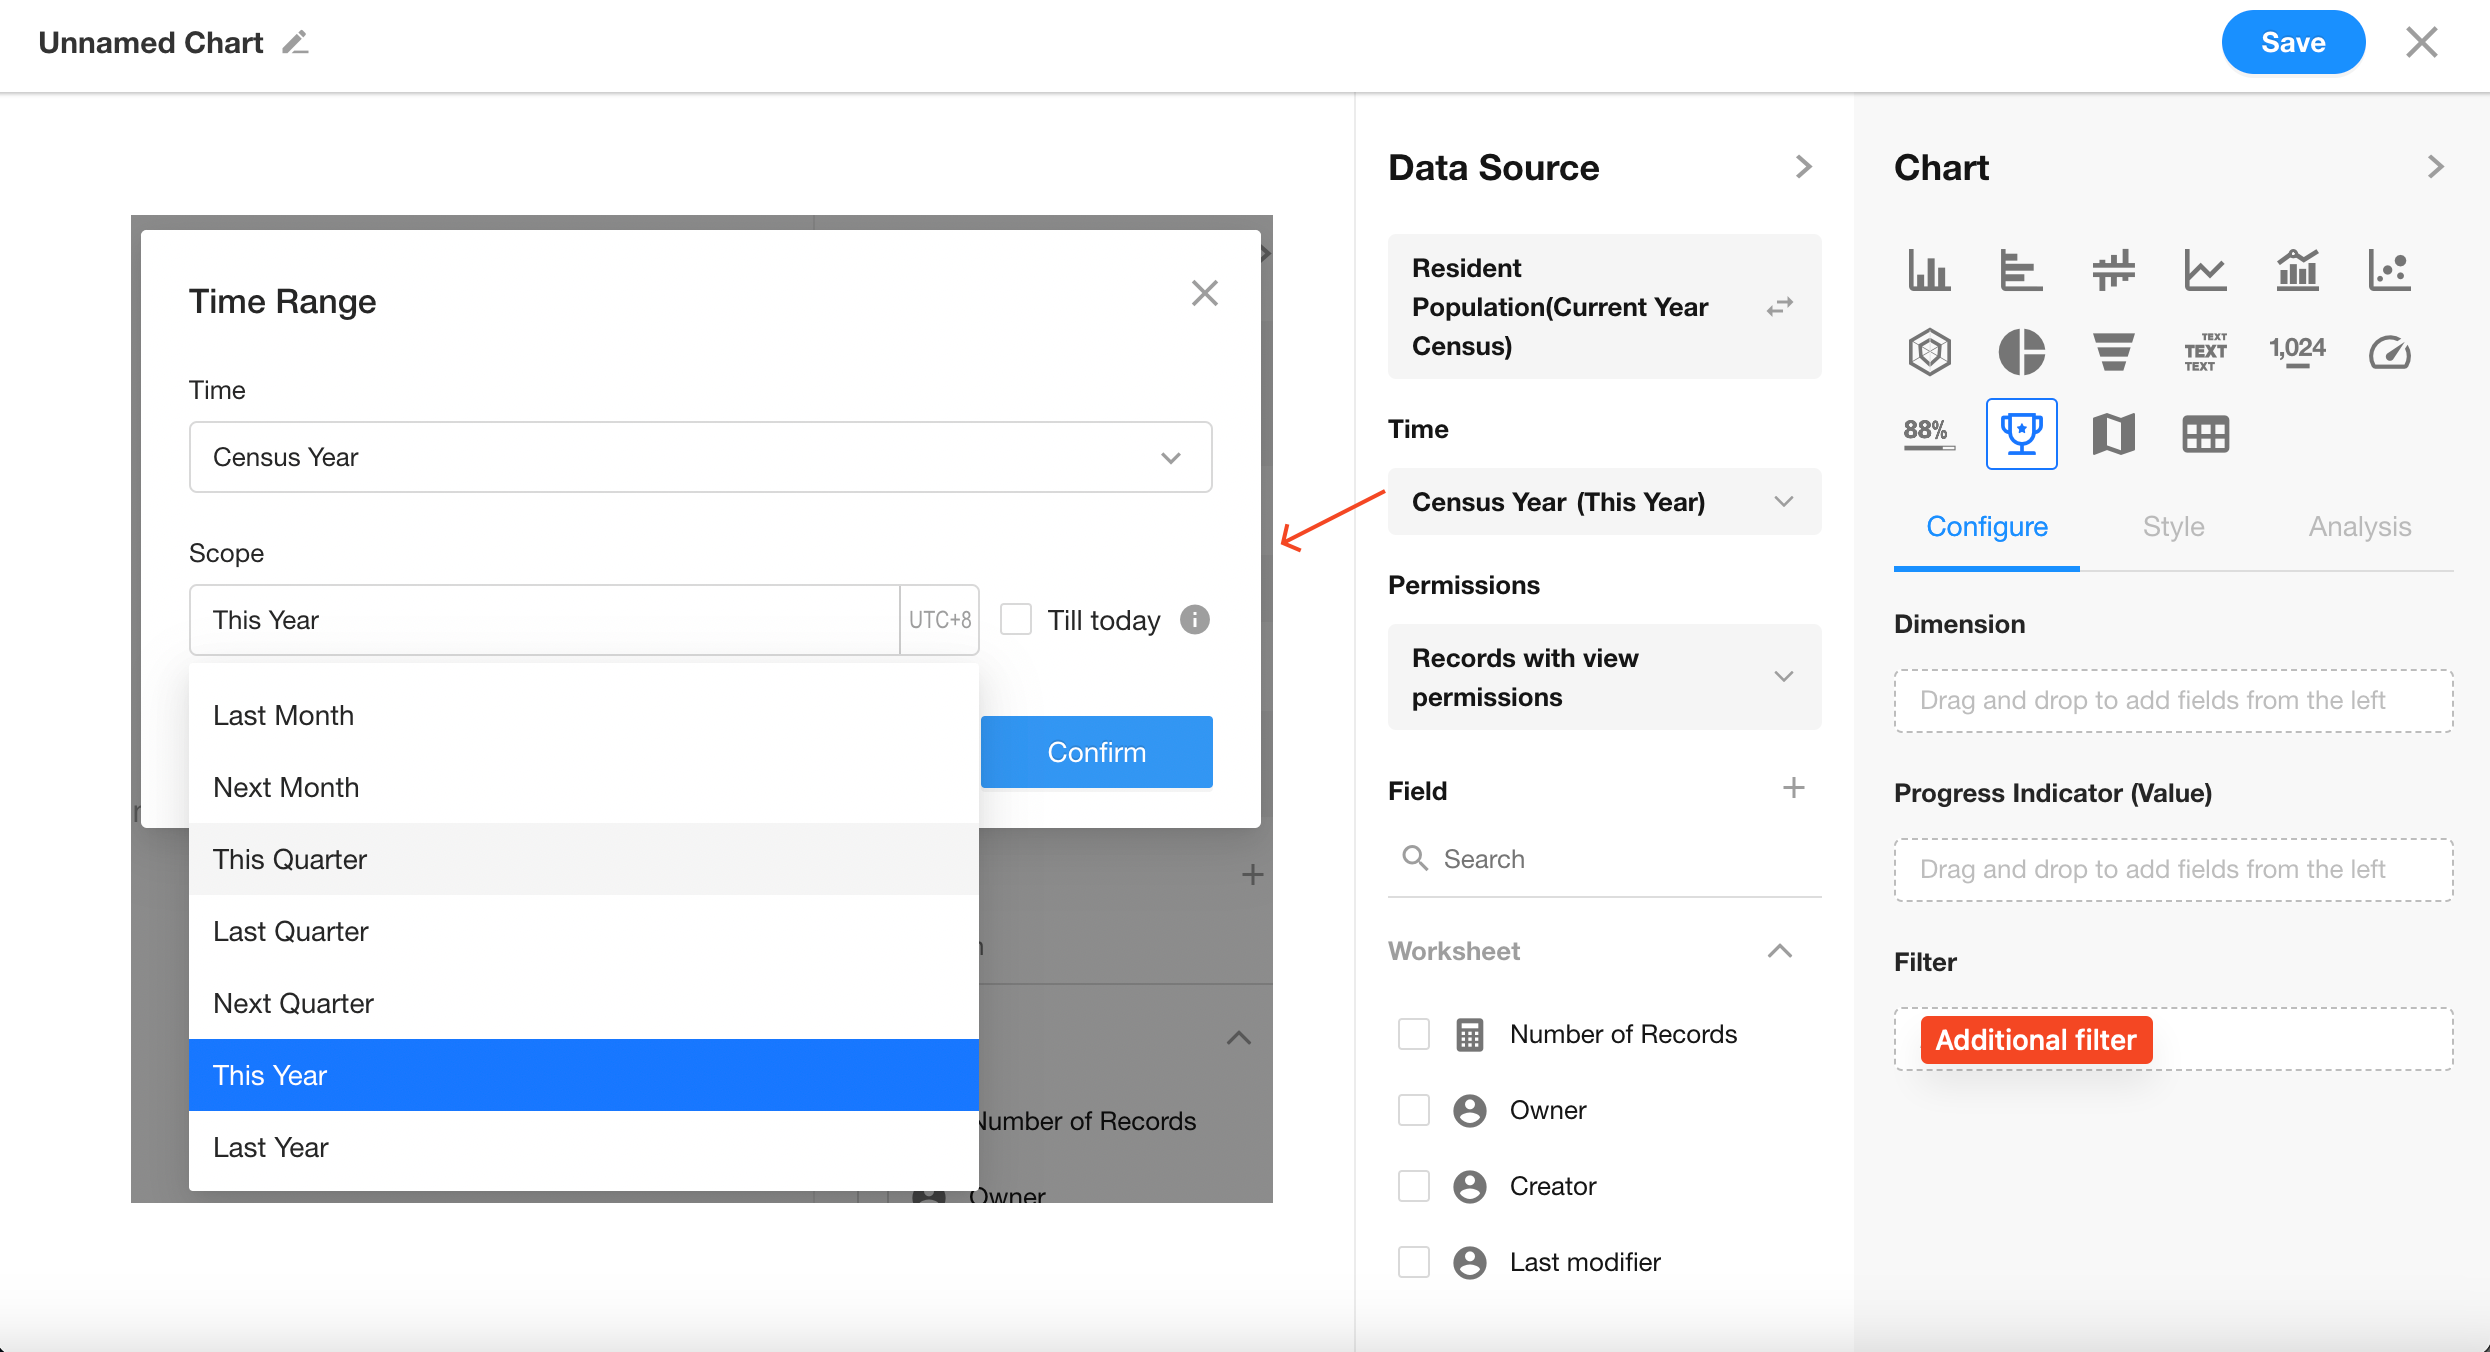
You can also add additional filters if needed.
3. Set Dimension
Select the City field as the ranking dimension.
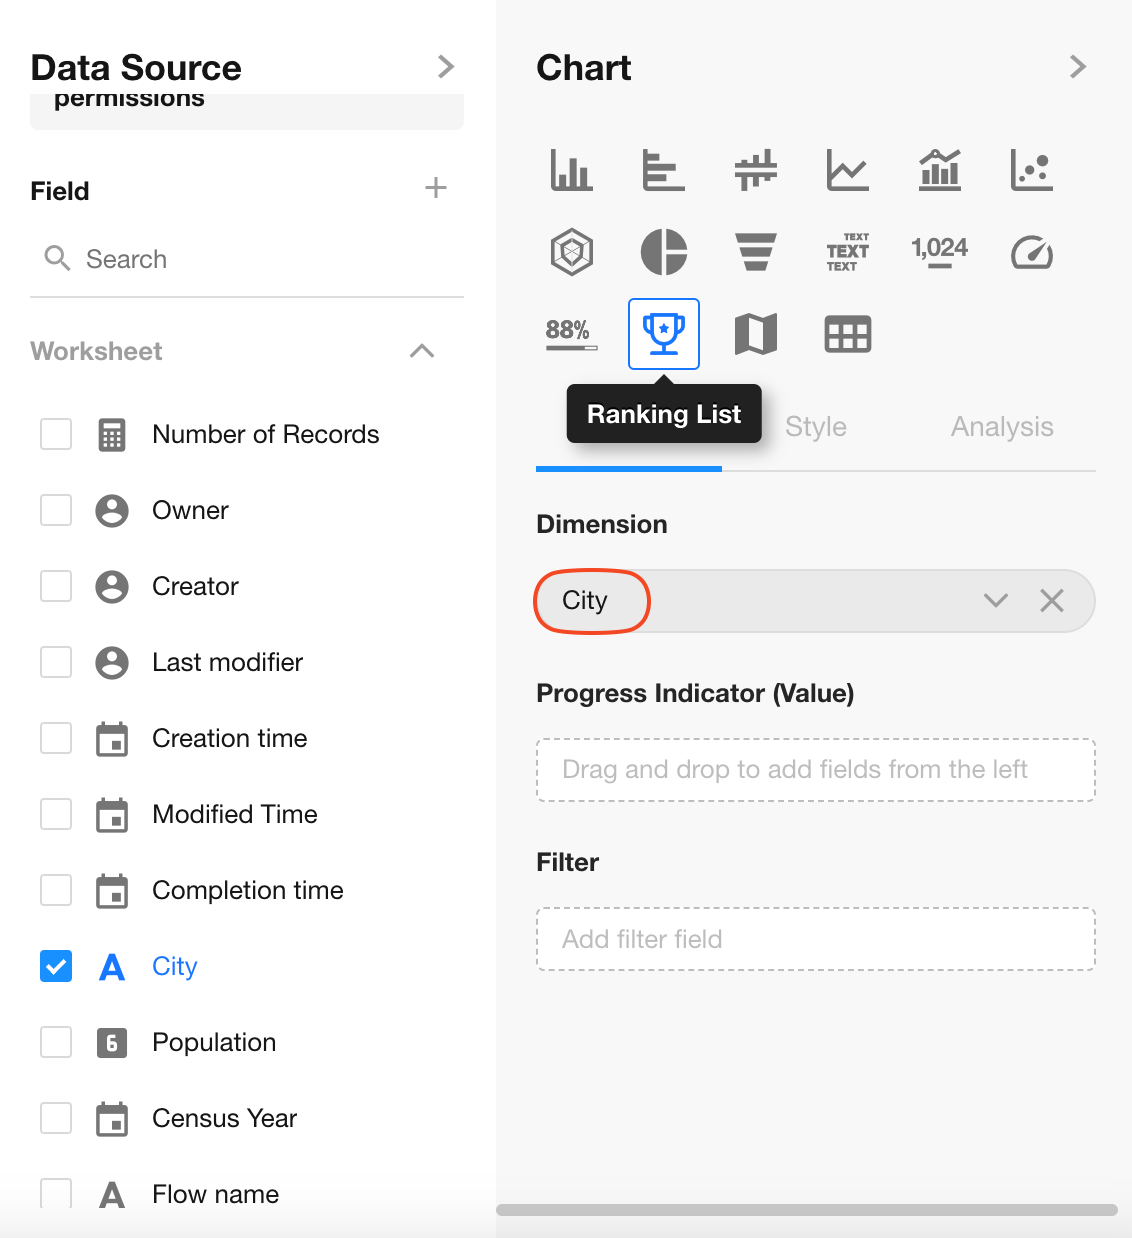
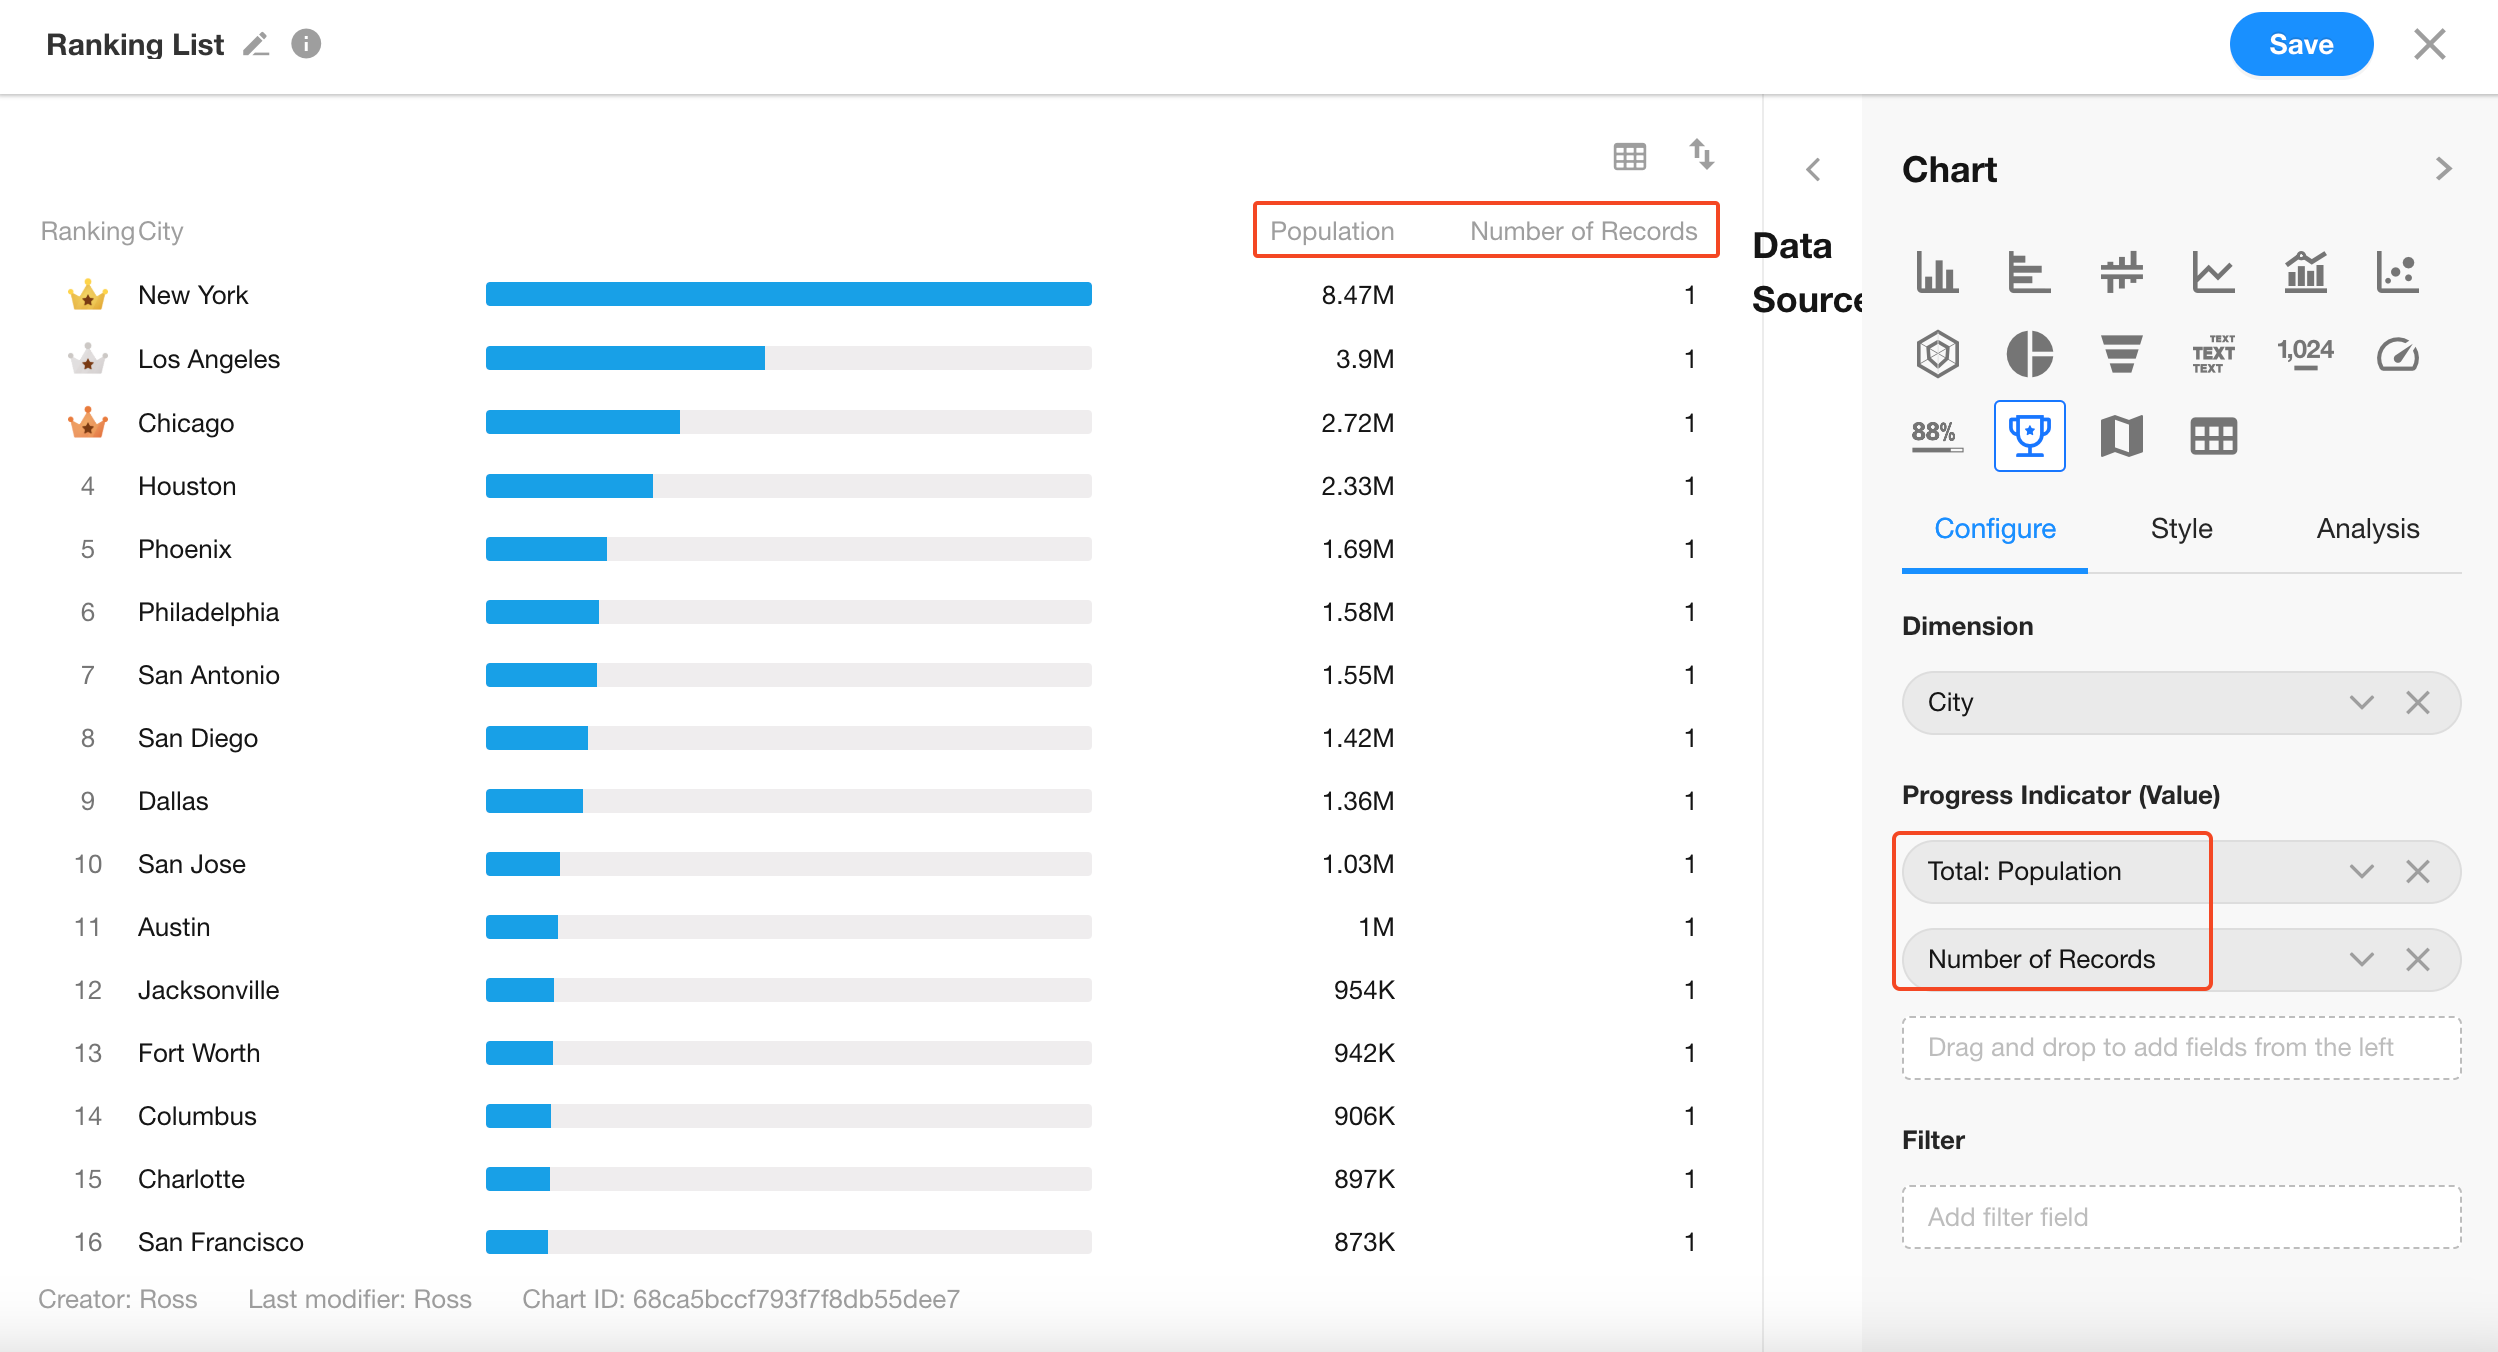
4. Set Value (Indicator)
Select the Population field as the metric for ranking.
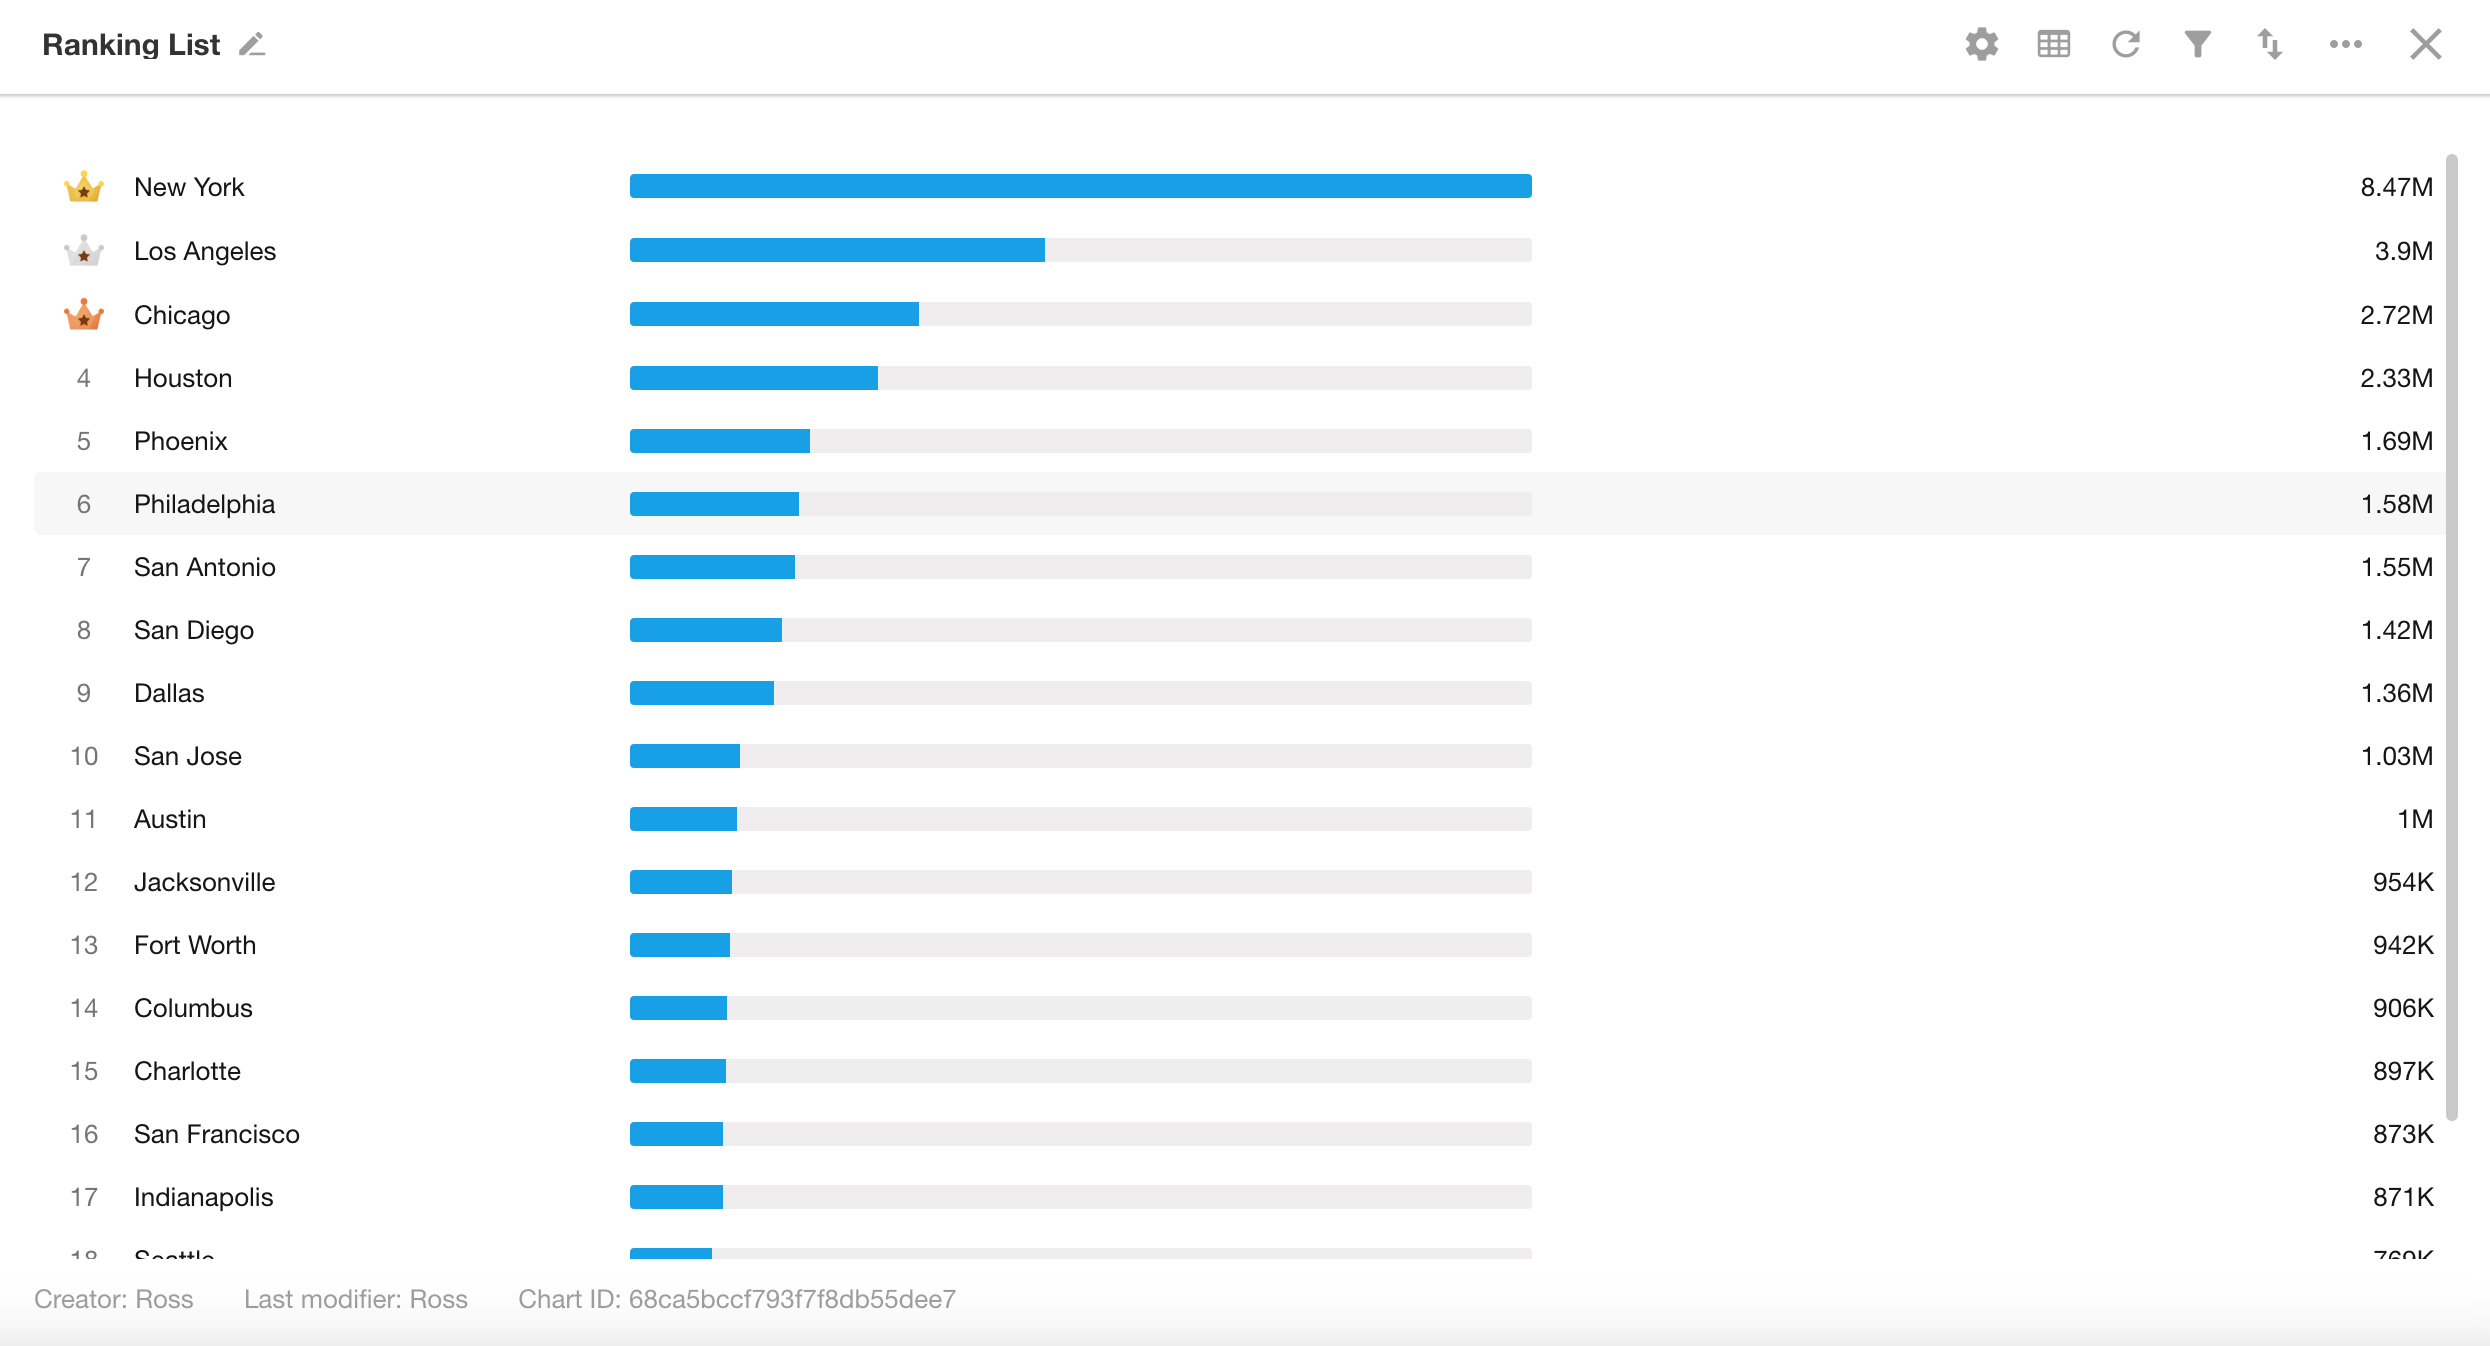
Click “Save” to apply the chart configuration.
If only one value is selected, the field name is not displayed. Multiple value fields will show their names.
Additional Style Options
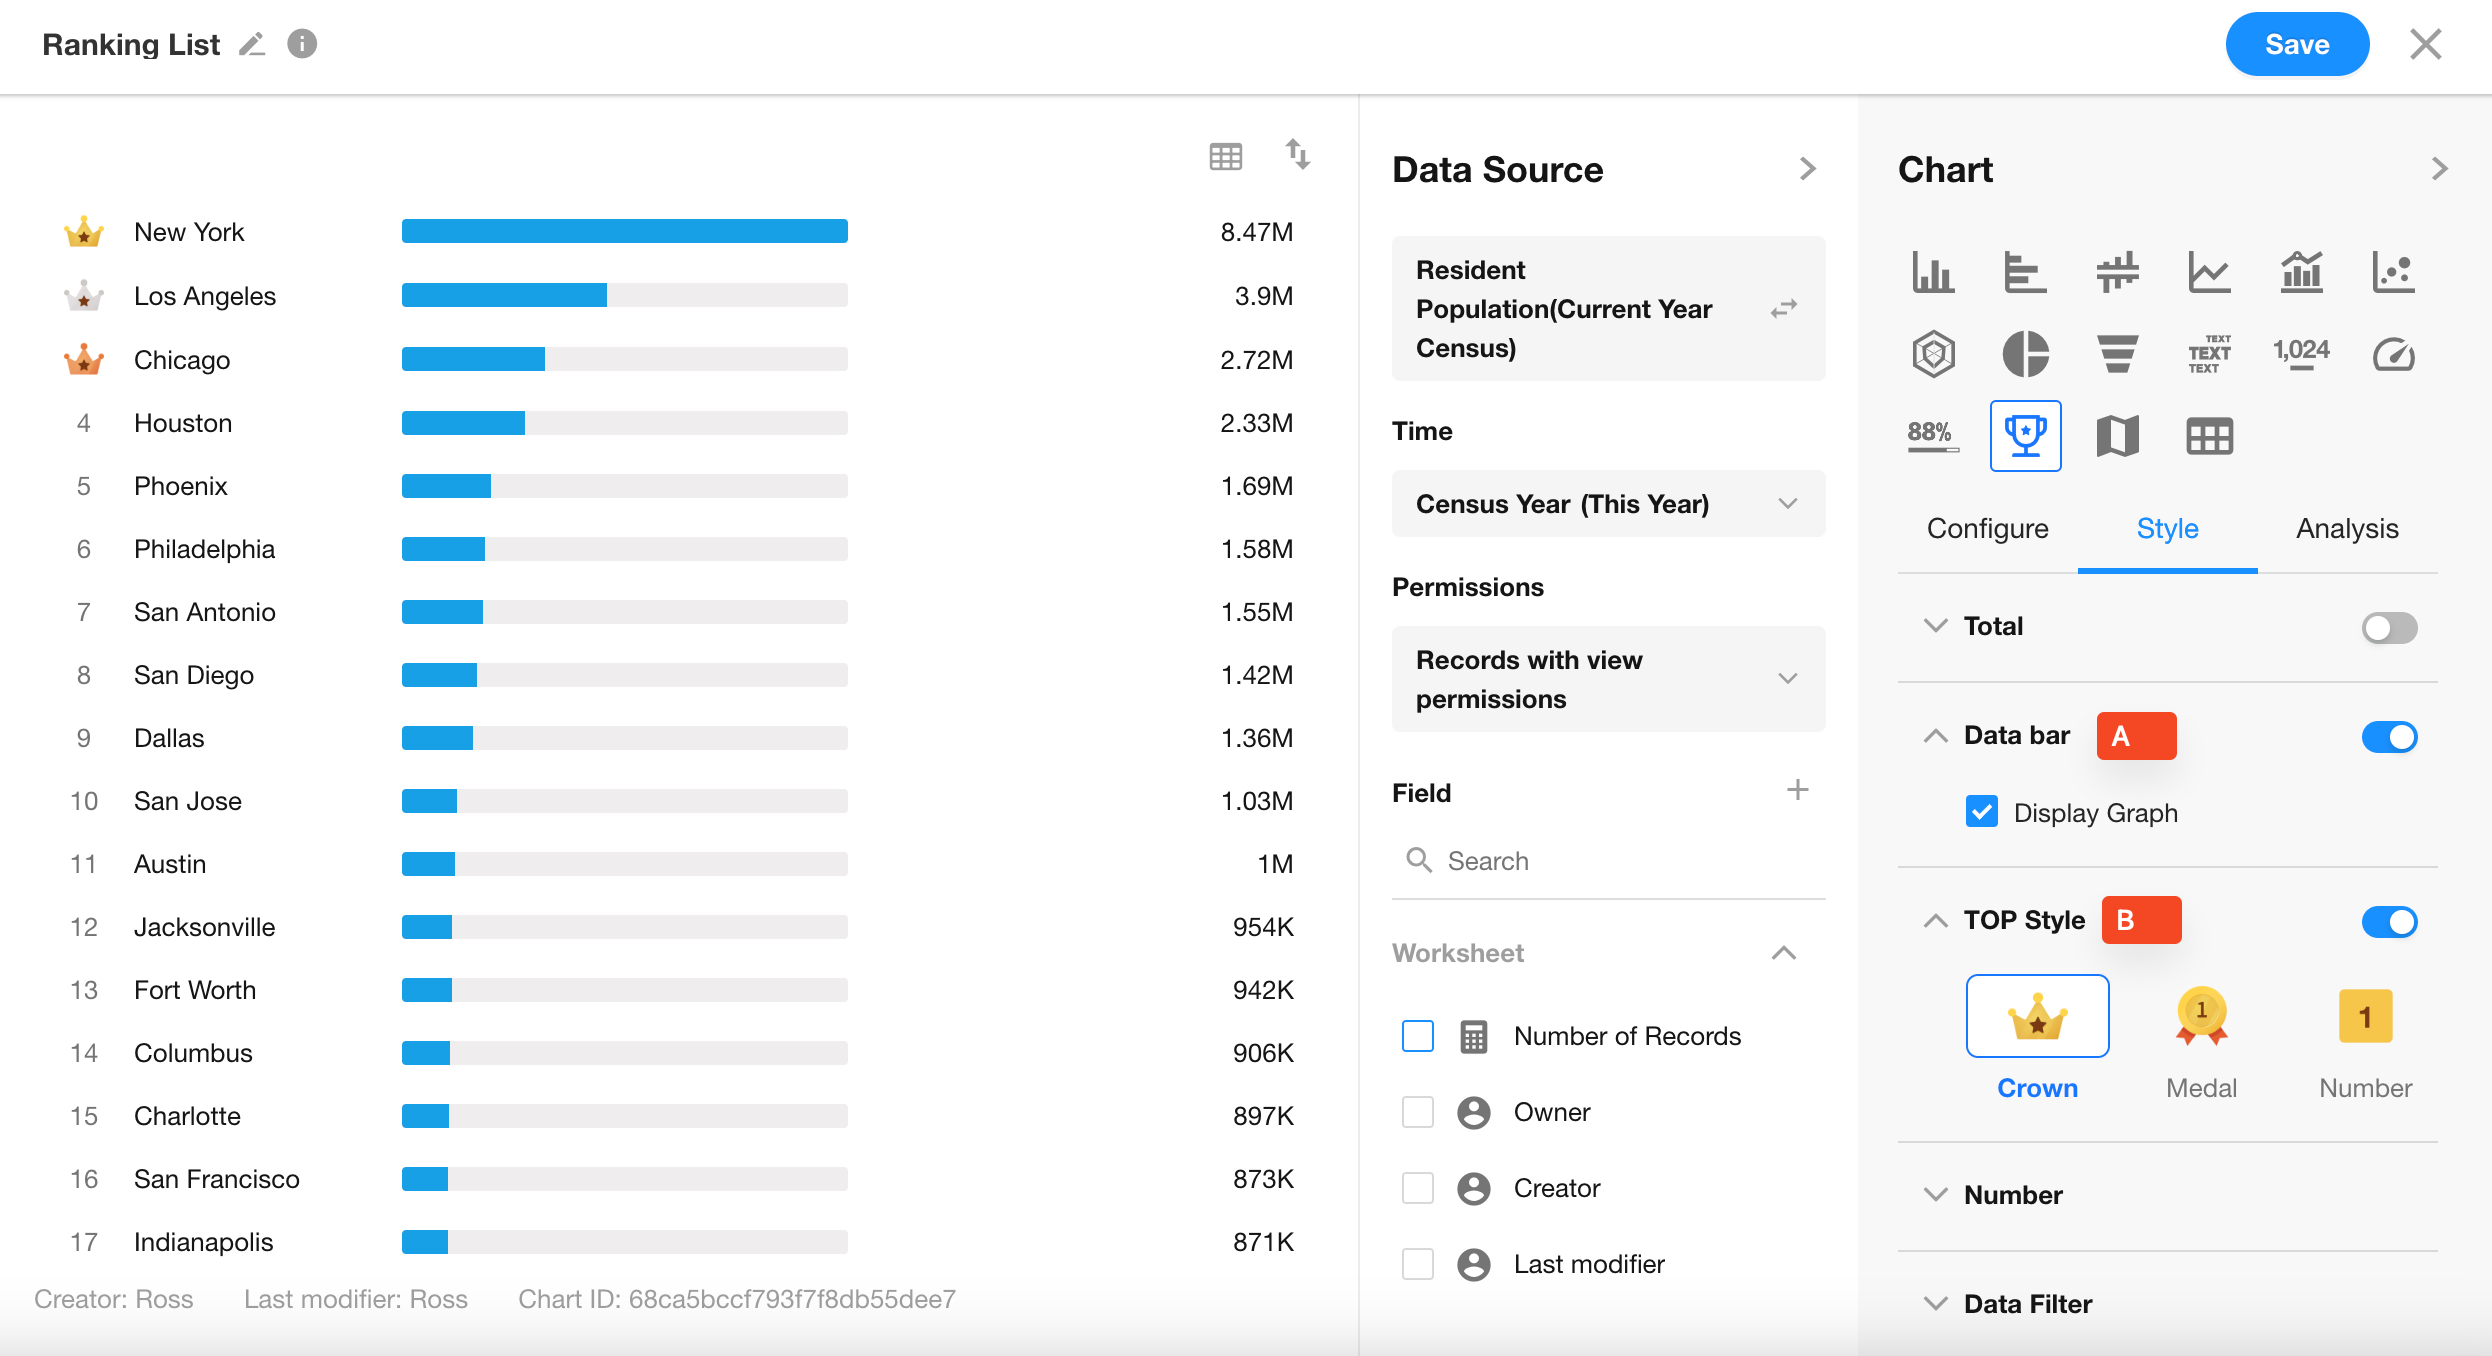
5. A: Data Bar
Data bars are enabled by default to visually represent the value for each ranked item.
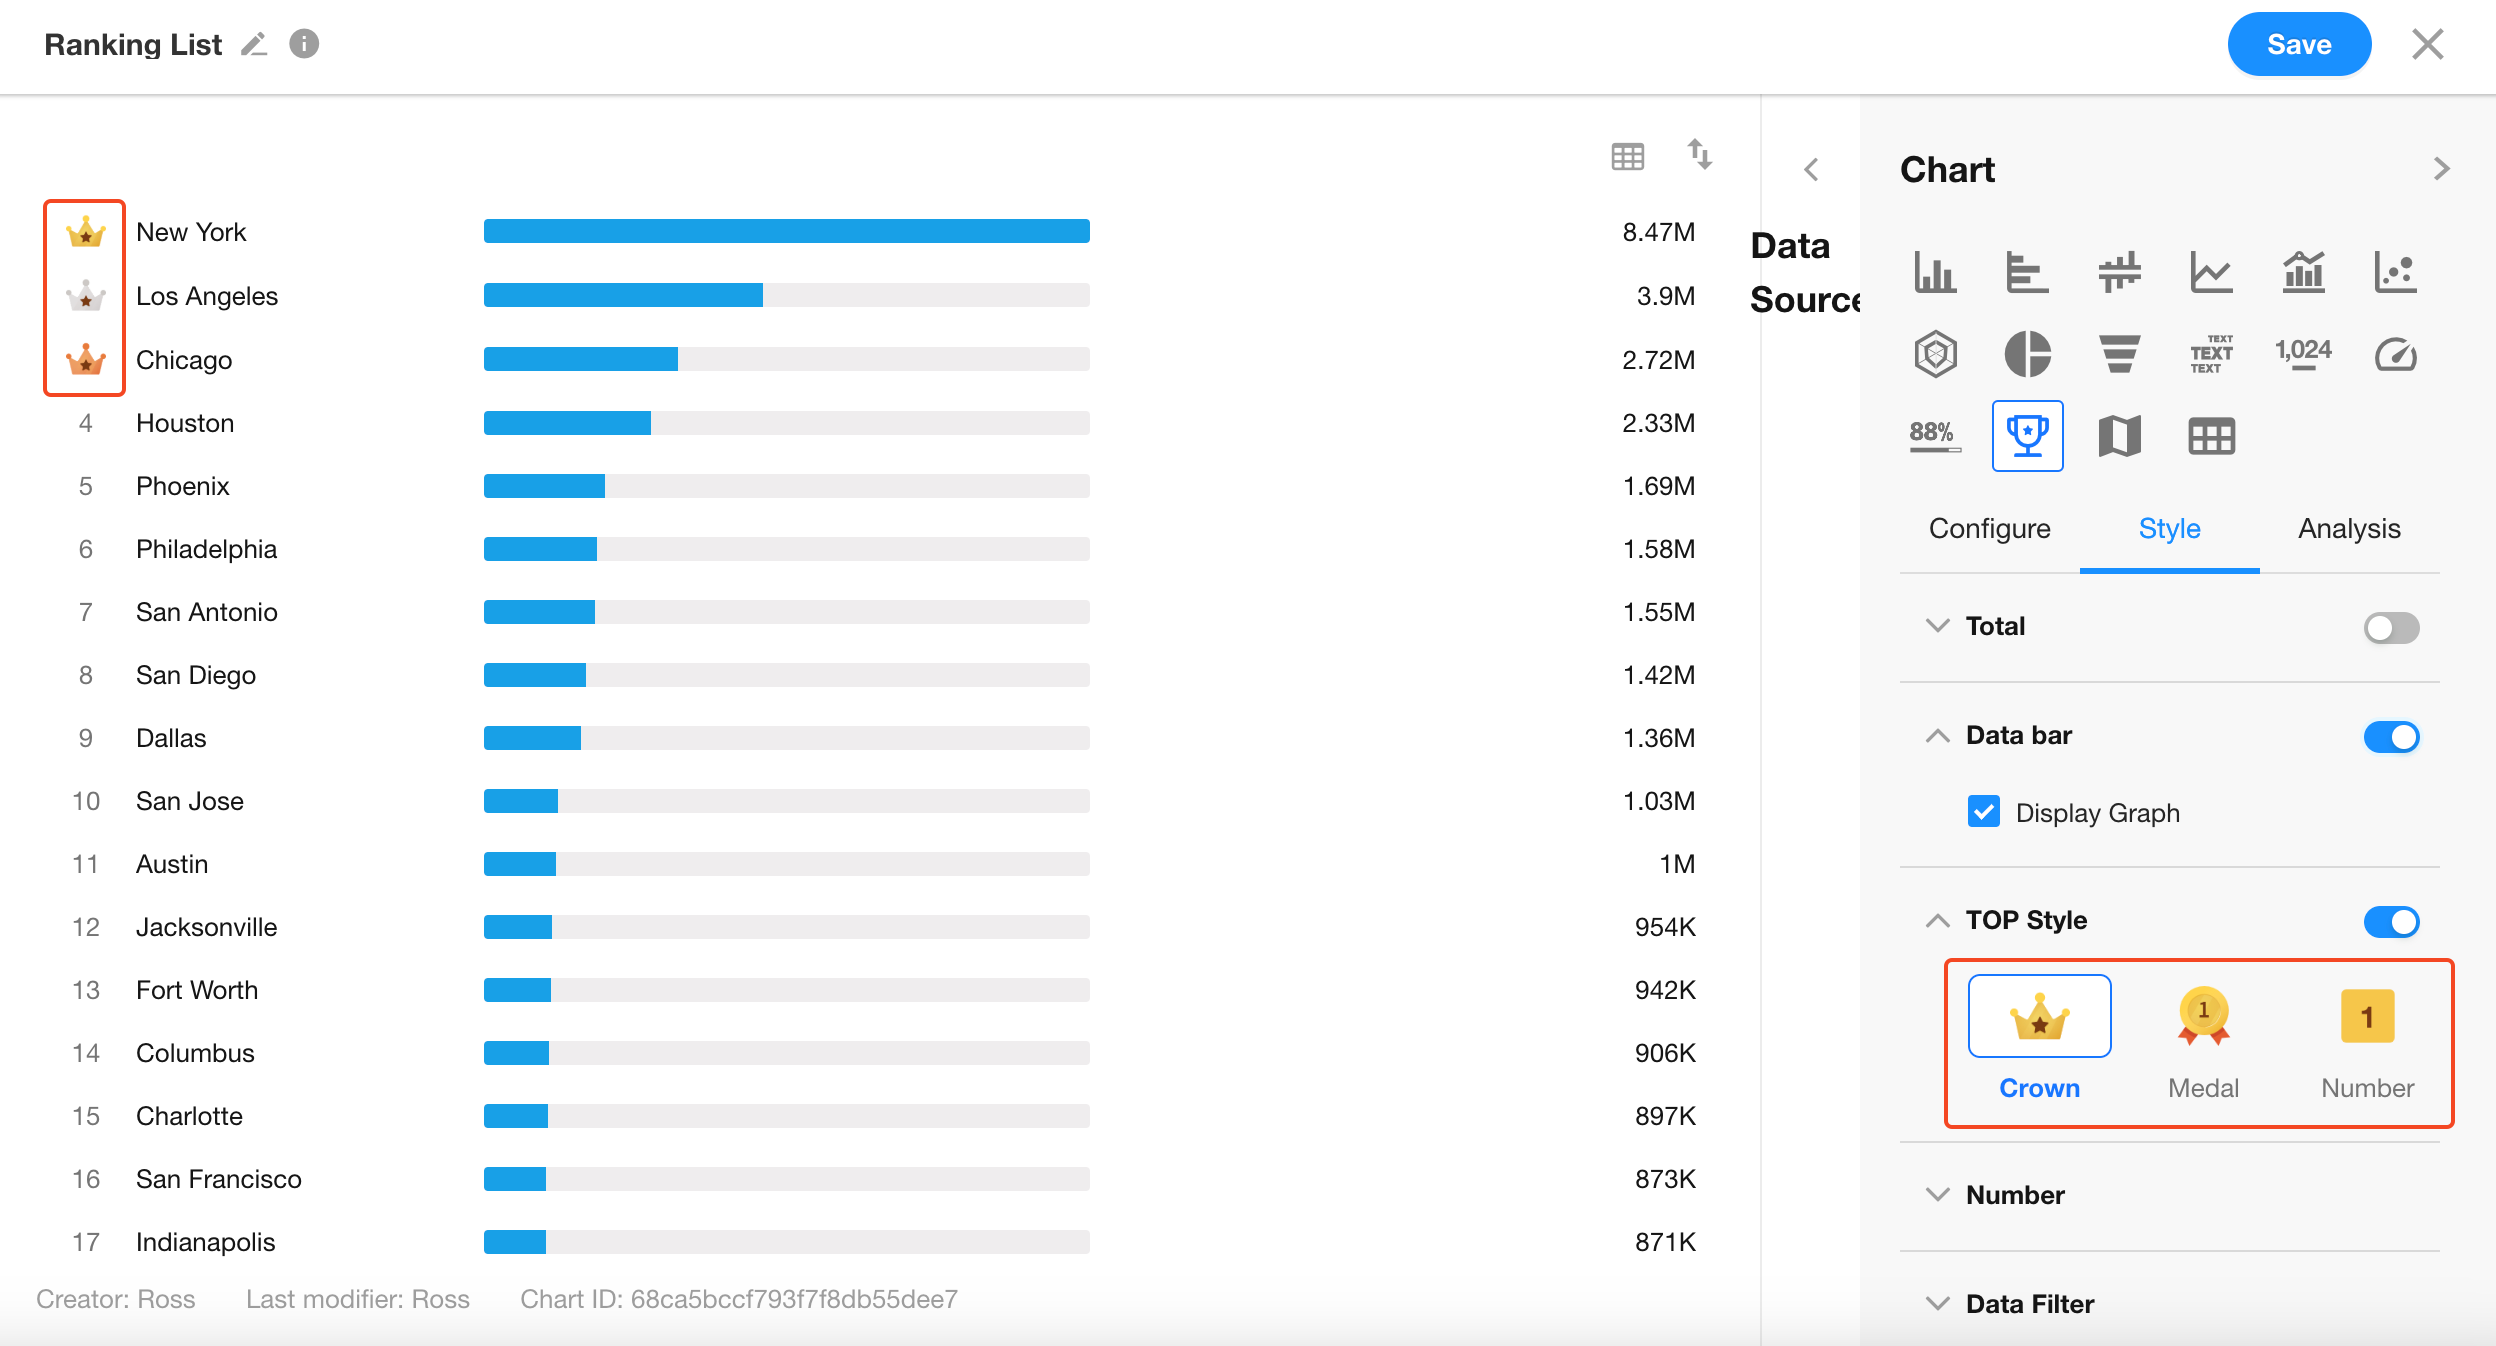
6. B: Top Style
Customize the appearance of the top 3 ranked items using special icons or styles.
Was this document helpful?