Gantt View in Task
Click on a project name and navigate to [Time] > [Gantt].
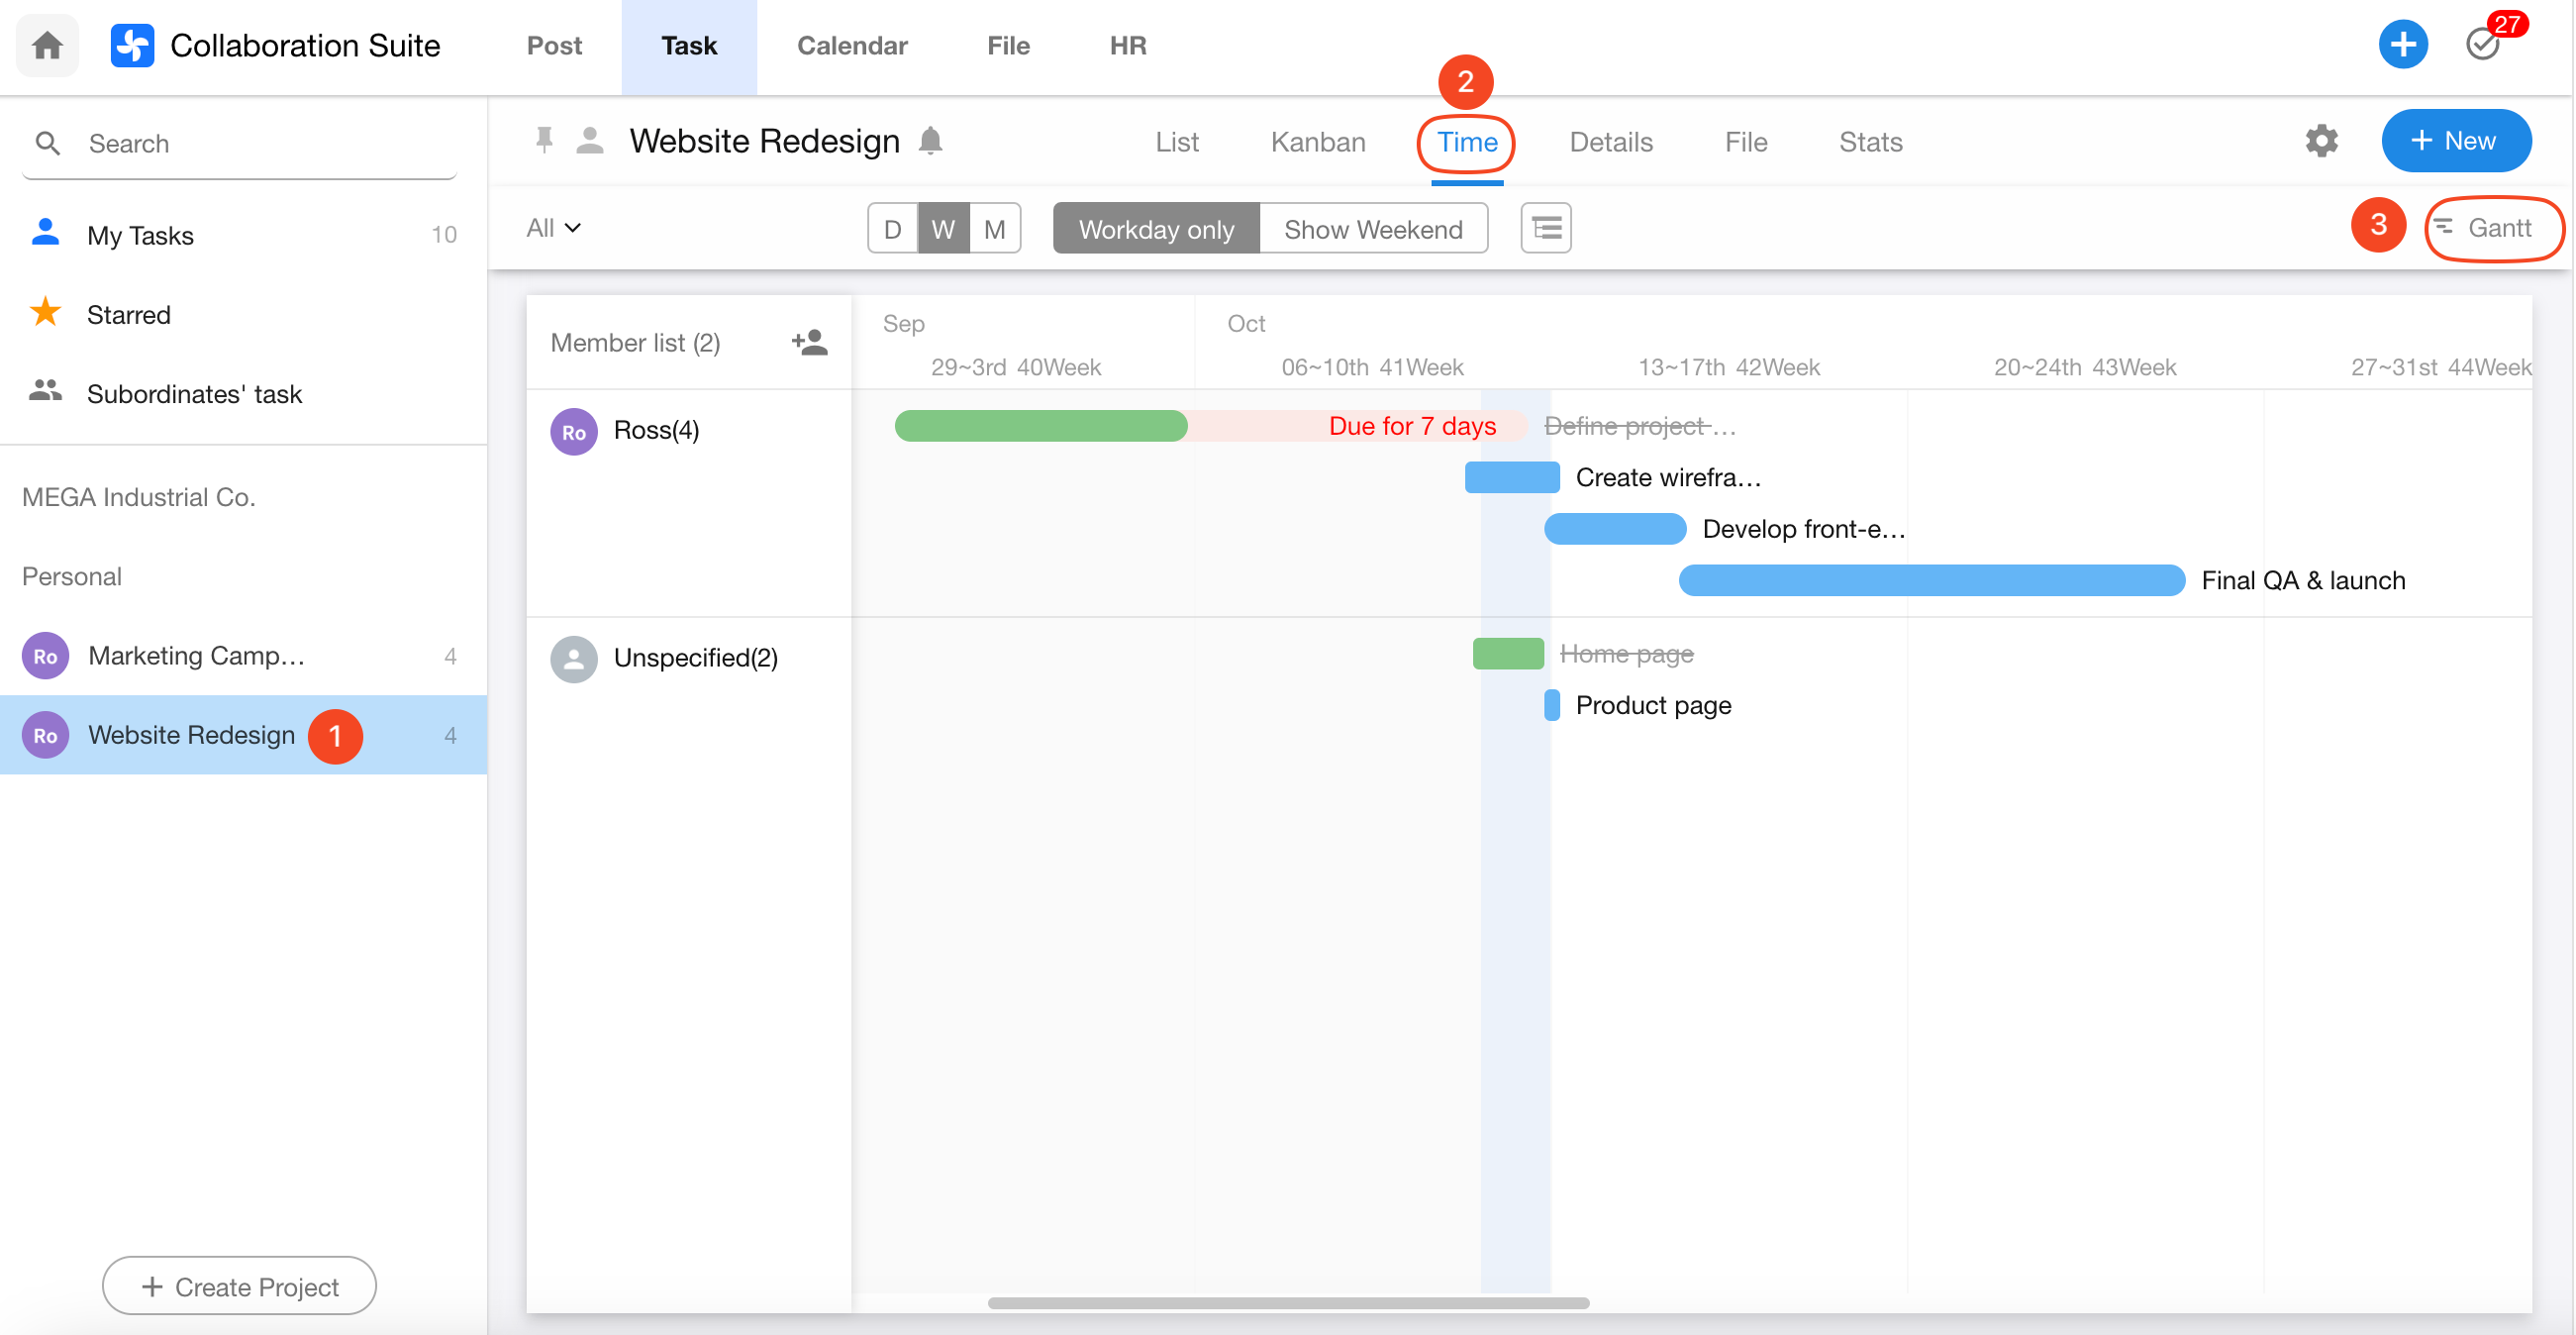
You can switch the display between day, week, or month views.
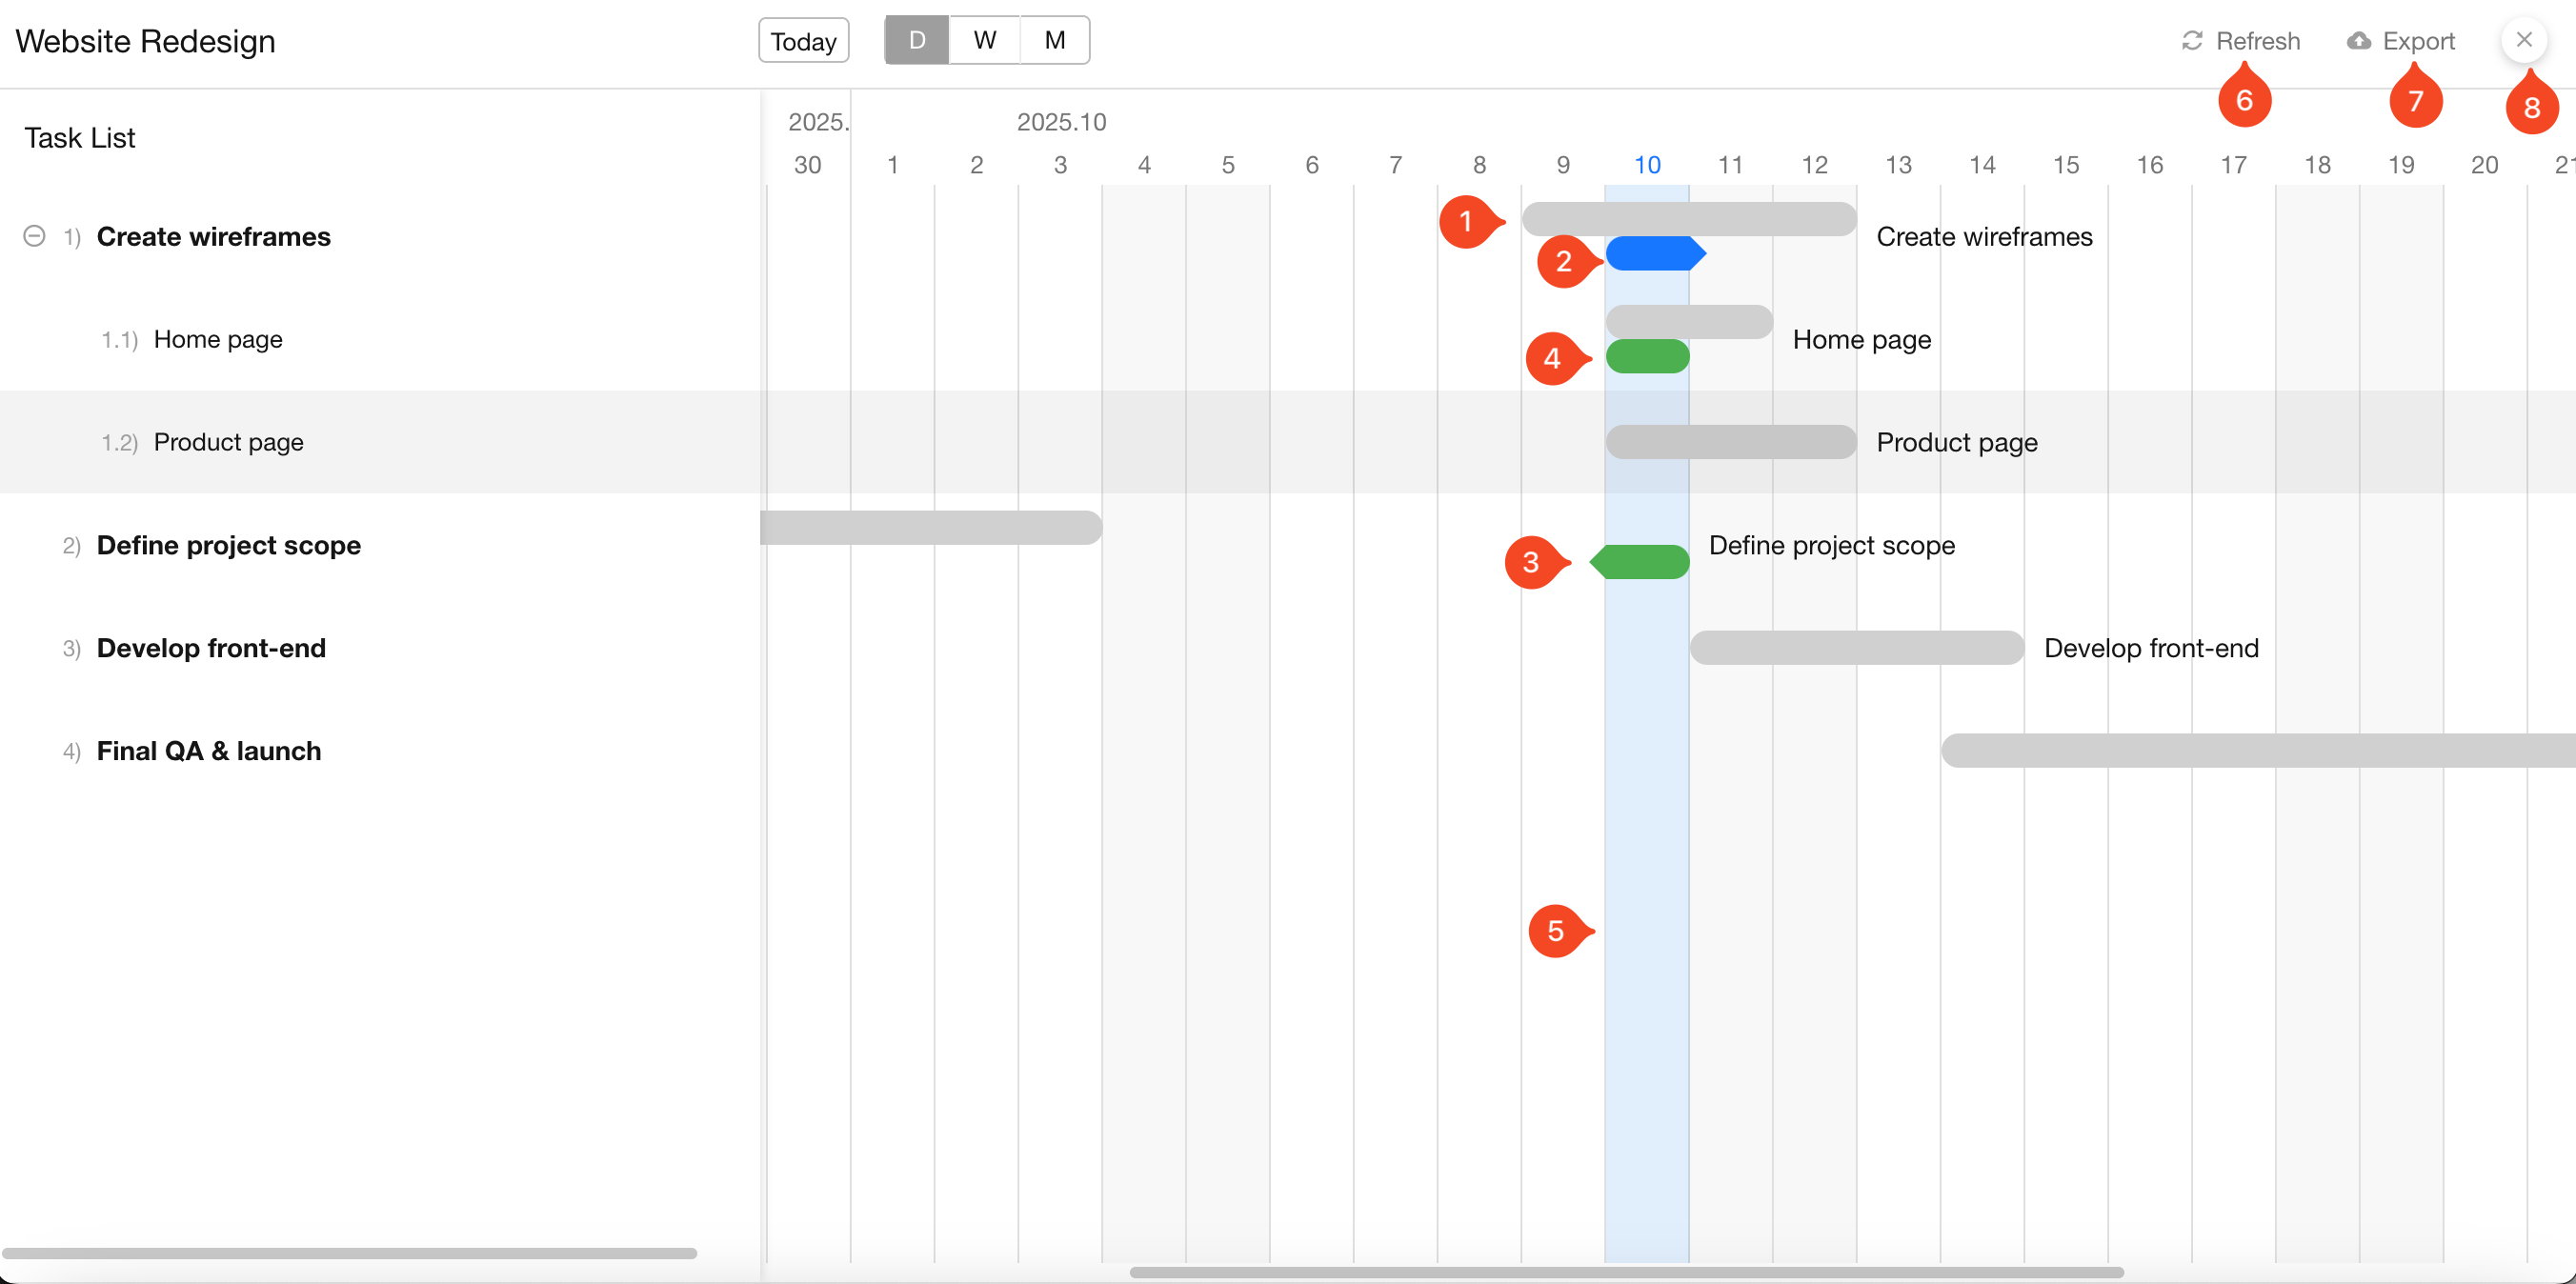
Click on any task bar in the Gantt view to open the task details for editing. After making changes, click Refresh to update the Gantt chart.
You can also export the Gantt view as an image.
About Task Progress Bars
Each task is represented by two bars (e.g., 1 and 2):
- Bar 1 indicates the planned start and end time.
- Bar 2 indicates the actual start and end time.
If neither planned nor actual start time is set, only the task name is shown without a progress bar.
-
Gray bar – Shows the planned start and end date. Both ends of the bar are rounded, indicating planned timing.
-
Blue bar – Indicates the task has started but not yet completed. The bar shows a rounded start and pointed end.
-
Green bar – Indicates the task has been completed earlier than expected, and not set actual start time. The bar shows a pointed start and rounded end.
-
Fully rounded green bar – Means the task has been completed and both actual start and end time set (e.g., started on 8.6 and completed on 8.9).
-
Light blue vertical line – Represents today.
-
After editing tasks, click the Refresh button to update the Gantt chart.
-
You can export the Gantt view as an image file.
-
Click to Exit Gantt View.
Was this document helpful?